Reopening Sentry
In this post, I want to talk about reopening Sentry, a tool I have used for a long time.
I have worked with Sentry-based error monitoring at my company for years. When an issue comes in, opening the stack trace, narrowing the scope with releases and tags, and finding the reproduction conditions are all second nature. Looking back, though, the features I used always stayed around that core. I knew Logs, Crons, Uptime, custom spans, and profiling existed, yet never turned them on.
The reason was not knowledge but exploration cost. To check whether a single feature fits my problem, I have to piece together scattered documentation, design an experiment, wire up the config, and interpret the results. On days when incident response was urgent, there was no reason to pay that cost. Since I recently started using Sentry MCP with Claude Code, a large part of that cost has come down, and my order of work has changed. Now, before turning a feature on, I first ask the actual data in this account.
This is the first article in a four-part observability series. It follows one outage caught by this blog's server instrumentation, records what became visible when I reopened that data through MCP, and gives a verdict on where each feature belongs. The series starts on the server, then moves through rendering, CPU, and memory inside the browser, and ends at search data.
Failure inside a successful response
I attached Sentry to this blog in August 2026, server-only. The decision to leave out the browser SDK is covered in part 2; here I only look at what I was trying to catch on the server. There was a single goal. The server calls the Google Analytics Data API to draw visitor statistics, and when that call failed, I had no way of knowing.
At first I assumed that adding a report to the catch in the statistics API route would be enough. But when I made it fail in a local production build with an invalid service account key, the error never reached the route. The catch in the statistics module one layer below caught it first and returned a default value, and the response looked like this.
HTTP 200 OK
{ "slug": "/260610", "views": 0 }
Visitors see statistics of 0, and the server answers that everything is fine. By the route's error rate, nothing happened. The Gray Failure paper that researchers from Microsoft Research and Microsoft Azure presented at HotOS 2017 defines the core of this state as follows.
We also argue that a key feature of gray failure is differential observability: that the system's failure detectors may not notice problems even when applications are afflicted by them.
We also argue that a key feature of gray failure is differential observability: that the system's failure detectors may not notice problems even when applications are afflicted by them.
So I moved the instrumentation point down from the route to four catch blocks in the statistics module. The fallback itself is the right choice for protecting the visitor experience, so I kept it and separately reported only the fact that the fallback ran. At the time, I distinguished the four places with a single tag, gaQuery.
// 2026-08 당시
Sentry.captureException(error, { tags: { gaQuery: 'stats' } })
In the current code, commit f348d4c on August 17 consolidated reporting into a single captureServerException and, to keep cardinality from growing, limited the tag keys to three: locale, routeKind, and operation.
// 현재 src/lib/google-analytics.ts
captureServerException(error, { routeKind: 'analytics', operation: 'stats' })
Today the statistics module reports from three catch blocks and one missing-credentials path. (I removed the popular path in September, for reasons I will get to later) The credentials path returns a fallback directly without going through a catch, and because of logic that adds a baseline of 10 to 40 to today's visitor count, a plausible number appears on screen. Even if the environment variables disappear entirely, a human would not notice, so I made it report only once per process.
338 seconds after a 5-second timeout
After moving the instrumentation down, the production issue that came in, JIHOON-BLOG-2, was a GA call that failed with DEADLINE_EXCEEDED after 65.877 seconds. The response was still 200. The cause was in the GA client library's configuration file. The default RPC timeout for runReport is timeout_millis: 60000, and my code passed no timeout at any of its five call sites. It is exactly the mistake that the deadline post on the official gRPC blog, written by Gráinne Sheerin of Google SRE, warns against from its first line: "Always set a deadline".
The fix commit 927c85b made every call pass a 5-second timeout. Reproducing it with a local TCP server that never responds gave results matching the explanation.
| Condition | Elapsed time | Error message |
|---|---|---|
| No timeout set | 60.04s | Deadline exceeded after 60.000s |
timeout: 5000 |
5.00s | Deadline exceeded after 5.000s |
(The number 5 has no basis. I did not measure GA's normal response distribution. But on this blog the visitor count is supplementary information, so I judged that giving up quickly was the right direction rather than waiting long) That issue no longer appears in the issue list. The value 65.877 seconds is a record left in the commit message and the repository docs.
It should have ended there, but in the release where the fix was deployed, a new issue, JIHOON-BLOG-8, started piling up. The message was Deadline exceeded after 338.655s, and the stack still contained the timeout wrapper from google-gax. The setting was reaching the code, yet the reported time was nearly 70 times the setting.
Around August 18, I pulled the 100 most recent events at the time and plotted the distribution.
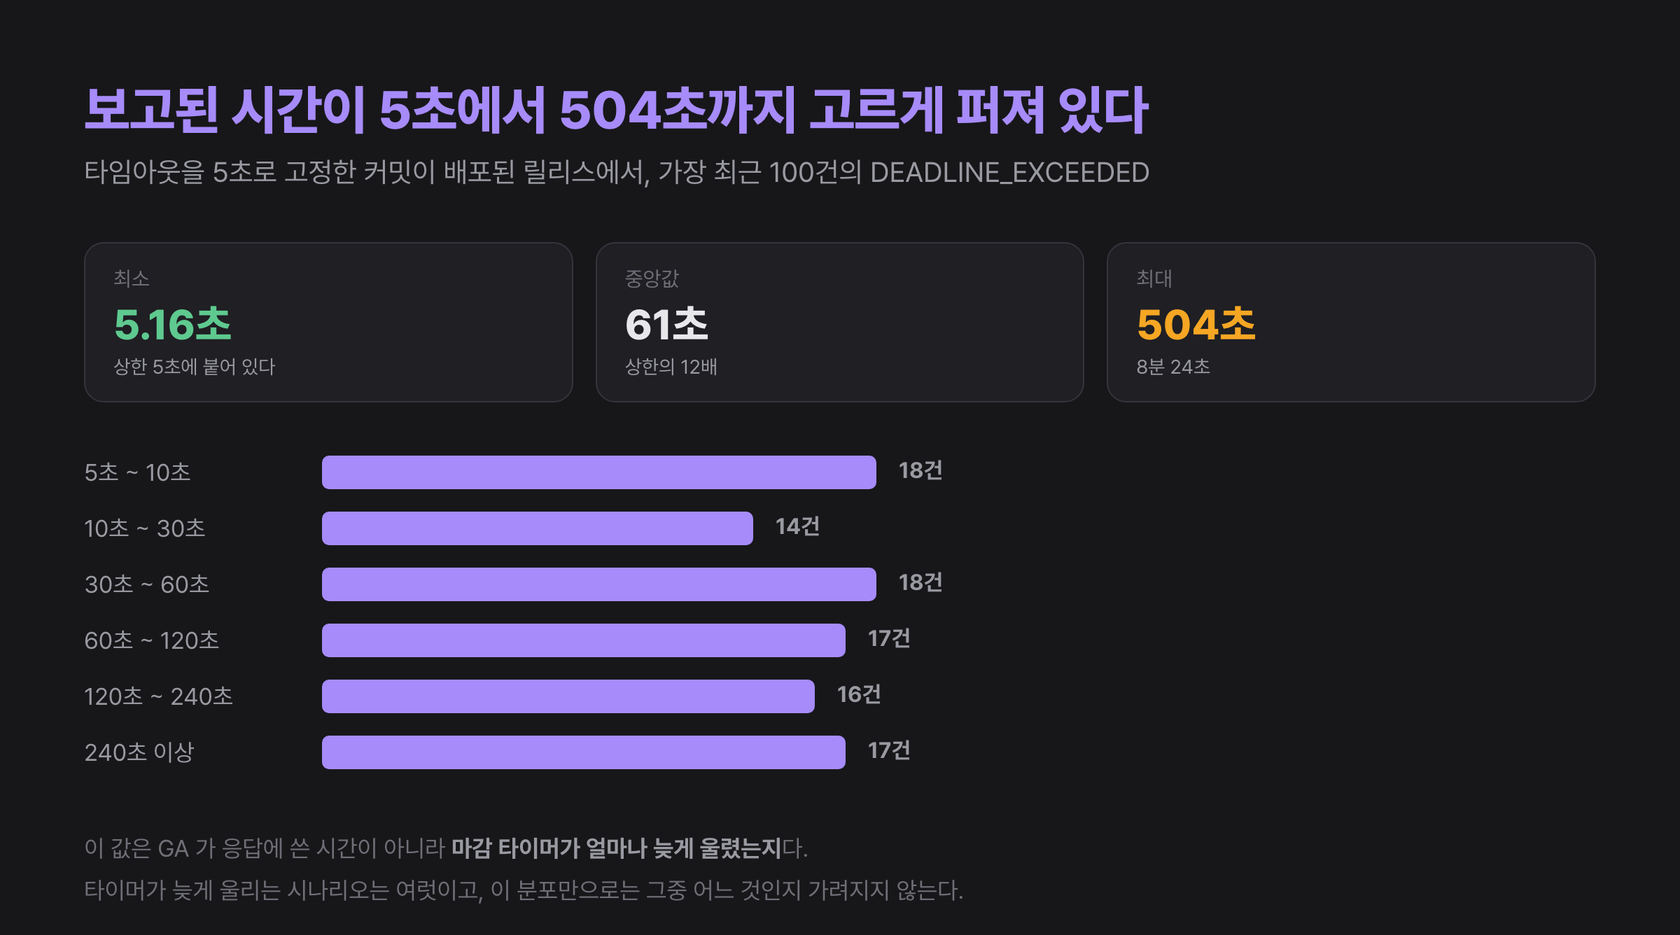
The lower bound was 5.16 seconds, right next to the setting, the median was 61 seconds, and the maximum was 504 seconds. The values did not cluster in any range. (I cannot redraw this chart now. The reason comes in the next section) The tag had only two values, stats and popular, and they usually arrived in pairs. What the two paths have in common is that they are revalidation paths behind a one-hour unstable_cache. page and pages, which call GA on every request, never appeared.
So I formed a hypothesis. A serverless function's execution environment can freeze after sending a response until the next invocation. If timers also stop during that time and fire only after waking up, what gets recorded is not the time actually spent waiting but wall-clock time that includes the frozen period. Still, a distribution not contradicting a hypothesis is different from supporting it. The same shape would appear if heavy work had been holding the event loop.
Reopening the data with MCP
While writing this article, on September 16, 2026, I queried the same data again through Sentry MCP. The point was to check whether what I believed was fixed still is, and things I used to hunt for by moving between issue screens in the dashboard came out in a few exchanges. Below, I separate the facts confirmed by querying from the inferences drawn from them.
Why the occurrences stopped
The last occurrence of JIHOON-BLOG-8 was at 13:45 UTC on August 18, and there have been 0 since. Looking only at the graph, the problem seems to have disappeared, but I never verified the hypothesis or fixed it. On the same day, commit 417d3b4 removed the visitor statistics and popular posts sections from the home page as part of the multilingual overhaul, and the screens that called stats and popular were exactly those two. The message of commit 5752e09, which deleted the remaining popular posts path in September, describes this as "the direct reason the events stopped is that the call sites disappeared, not the 5-second timeout". Lining up the timestamps, though, that commit was pushed to main at 22:07 UTC, more than eight hours after the last event. With only about ten events a day remaining, an eight-hour gap is not unusual in itself, and it does not contradict the fact that nothing has occurred since the deploy. Still, the timestamps alone cannot establish that removing the call sites is why it stopped, so I read that message as the most likely explanation and nothing more.
An issue being resolved is not proof that the cause was identified. There are three ways for occurrences to reach zero: it was actually fixed, nobody walks that path anymore, or the instrumentation disappeared. The error signal alone cannot tell these three apart.
5 minutes 39 seconds left in the breadcrumbs
I pulled the breadcrumbs of the last event through MCP. Breadcrumbs usually bring to mind clicks and navigation in the browser, but this blog's Node server SDK was also automatically recording http requests and console output.
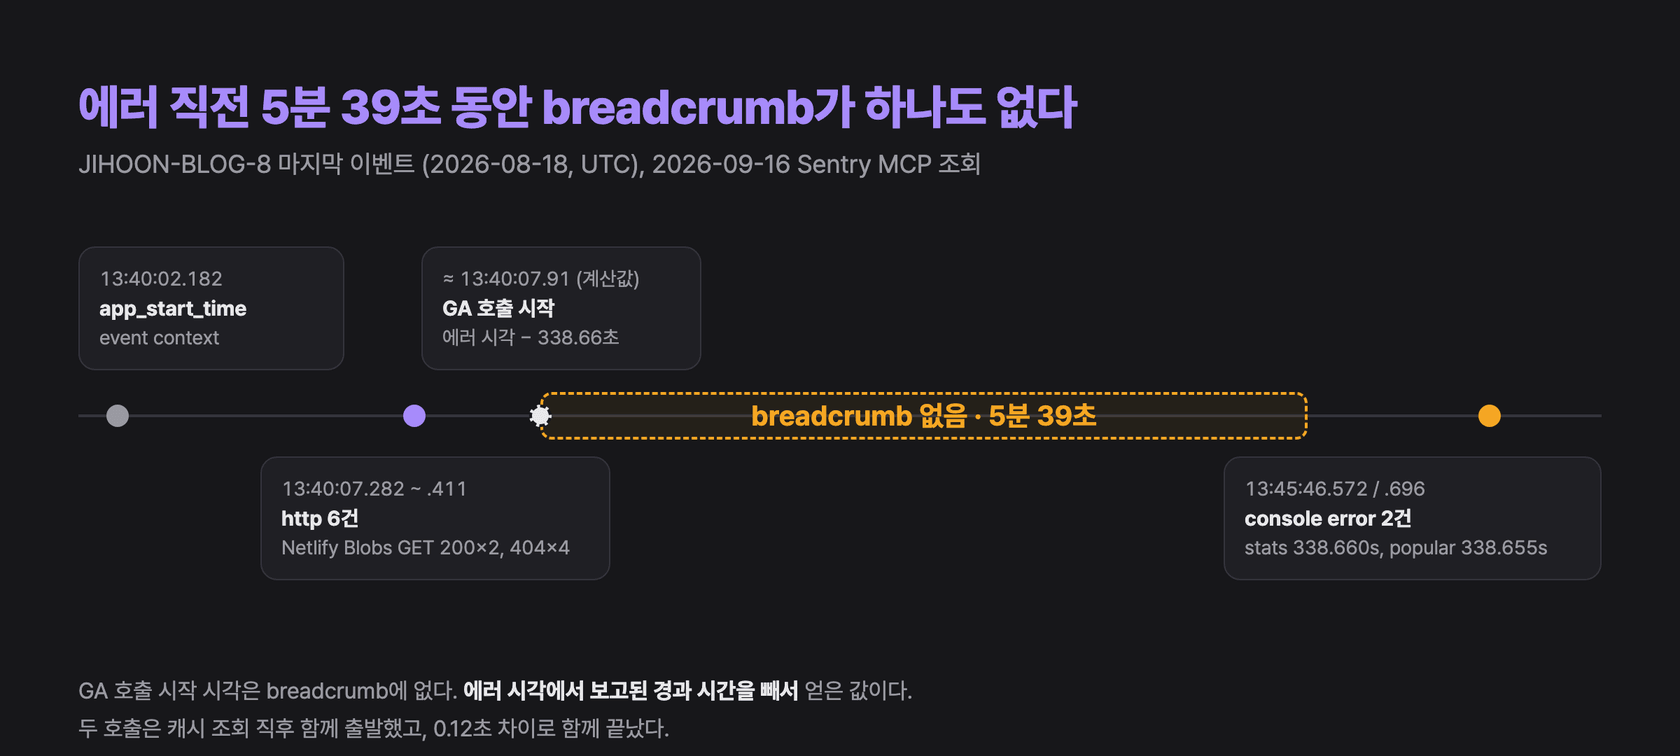
Here are the facts. The function started at 13:40:02, and at 13:40:07 there were six Netlify Blobs cache lookups. The next records are two console errors at 13:45:46. Subtracting the reported 338.66 seconds backward, the GA call started 0.5 seconds after the cache lookups and about 6 seconds after the cold start.
What can be drawn from this is limited. A timer that should have fired after 5 seconds fired after 5 minutes 39 seconds, and in between this request left no records at all. It does not contradict the freeze hypothesis, but it does not rule out the event loop blocking hypothesis either. Still, one piece of information emerged that I did not have before: the start time showing that the failure was a call that started from cache revalidation right after a cold start.
Events erased by retention
The occurrence counter on the JIHOON-BLOG-8 issue is 144. Aggregating the same issue over 90 days in the errors dataset returns only 10 as of a query at 14:26 UTC on September 16, 2026. The remaining 10 run from 15:03 on August 17 to 13:45 UTC on August 18, almost exactly within 30 days of the query time. A query at 08:45 UTC the same day returned 14, so this number shrinks every time I look.
As an inference, it looks like the event retention period is 30 days, so older events were deleted and only the issue counter remains. Sentry's pricing page lists the lookback for Developer, the free plan, as 30 days. However, I did not verify this account's plan type or how the counter is maintained. What is certain is the result. The 100-event distribution above cannot be pulled again, and data that was never stored cannot be restored by any tool.
A trace with zero spans
Opening the trace by the same event's trace_id shows 0 spans. The event carries client_sample_rate: 0.1. It may have been dropped by 10% sampling, or it may have exceeded the span retention period, and I could not tell which.
Grouping http.client spans from the last 30 days by domain did not show the GA API domain either. Most are Netlify Blobs lookups. The most likely explanation is that there were almost no GA calls during that period (the statistics section on the home page had already been removed). I have not yet checked whether gRPC calls are captured as spans by automatic instrumentation. Note that count() in this aggregation is an extrapolated value weighted by the inverse of the sampling rate, but the MCP response carried no such warning. Not reading the number as a request count is still up to a human.
Local verification mixed into production
JIHOON-BLOG-B, opened on September 16, is Google Analytics credentials missing: GA_PROPERTY_ID. Opening the event, the URL was http://localhost:3117/api/analytics, the browser was curl 8.7.1, and the server name was my MacBook. Yet the environment was production.
This event came from me following the local verification procedure in the repository docs (pnpm build followed by pnpm start). In src/lib/sentry-options.ts, if SENTRY_ENVIRONMENT is not set, the environment is taken from Netlify's CONTEXT. It is a mechanism built to separate Deploy Previews from production, but locally, where neither exists, it passes no environment value, and the event ended up stamped production. It blocked previews but not local runs. If I set up production-based alerts in this state, my experiments would trigger them.
So I added SENTRY_ENVIRONMENT=local to the verification command in the repository docs. The reason I did not change the default in code is that I have not yet confirmed that CONTEXT is always visible in the Netlify function runtime. If I set the default to local without confirming, production events could this time hide under local.
What to use where
I checked the features I had not turned on the same way, starting from the data. Over the last 30 days there were 0 logs, 0 profiles, 0 replays, 0 cron monitors, and 0 uptime monitors. Instead of reading config files and writing "not enabled", I confirmed "it is 0". The table below summarizes each feature's current state, rechecked against official documentation and changelogs on September 16, 2026.
| Feature | Question it answers | Prerequisite | Cost | Verdict for this blog |
|---|---|---|---|---|
| Issues and grouping | Are these events one incident? | SDK, source maps | Error quota | In use |
| Crons | Did the scheduled job run on time? | Sending check-ins | 1 included, more via PAYG on paid plans | Turn on |
| Uptime | Is the URL 2xx from outside? | None | 1 included, more via PAYG on paid plans | Consider as backup |
| Alerts | When should a person be woken up? | Separate environments | No separate pricing line | Whether it occurred, not a count threshold |
| Logs | When and how often did the fallback run? | SDK config | 5GB included | Candidate for GA calls |
| Application Metrics | What is the distribution regardless of sampling? | Supported JS SDK version | 5GB included | Candidate for GA calls |
| custom span | Which segment inside the request was slow? | tracing | Span quota, 10% sampling | Candidate |
| Session Replay | What did the user see? | Browser SDK | Bundle, replay quota | Off (part 2) |
| User Feedback | What does the user say went wrong? | Browser SDK | Bundle | Off |
| Browser profiling | Which JS function blocked the main thread? | beta, Chromium, headers | UI profile hours | Decided in part 3 |
| Seer | What is this issue's cause and fix? | GitHub/GitLab integration | $40/mo per active contributor | Not run |
| Sentry MCP | How do I query data from the editor? | OAuth connection | Agent tokens | In use |
| Agent Tracing | Tracing LLM calls and tool execution | AI SDK integration | Span quota | Not applicable |
Turn on Crons
The first thing to turn on is Crons. This blog collects Search Console data every Monday with GitHub Actions, and if that job silently fails to run some week, not even an error occurs. That is because it is not a failure but the absence of an expected event. As described in Sentry CLI's Crons documentation, wrapping the existing command in the form sentry-cli monitors run --schedule "<expected schedule>" <monitor-slug> -- <command> sends the start and end as check-ins, with authentication through the project DSN. According to the pricing docs, every plan includes one cron monitor and additional ones can only be bought with a PAYG budget on a paid plan, but this use needs only one.
Uptime makes a clear contrast. It periodically hits a URL from outside, and by default any 2xx passes, so with the default settings it cannot catch the failure inside a 200 response we saw earlier. Verification, available to the Early Adopter program, can check even the JSON body, but that still would not help much here. Most failures came from the cache revalidation path rather than visitor requests, and nothing on the client calls the stats API route anymore. It is meaningful as a backup for when the whole site goes down, but it sits at a different layer from the outage this blog actually went through.
Logs and Metrics for GA calls
There is a reason error events alone are not enough for GA calls. Because unstable_cache caches even failure results for an hour, error events on paths behind the cache are at most one per hour. Reading the event count as the scope of impact leads to systematic underestimation. And as we saw in the previous section, old events disappear, so the distribution could not be redrawn.
Sentry's Next.js breadcrumbs documentation recommends right at the top using Logs instead of manual breadcrumbs. Logs became generally available in September 2025, and they suit recording each fallback execution along with its elapsed time. If the distribution itself is the goal, Application Metrics, generally available since May 2026, is more direct. The span metrics documentation also points to Application Metrics for aggregations unaffected by trace sampling. Custom spans are good for looking at segments within a single request, but as a 10% sample they miss rare failures. I have not turned on any of the three yet, and if I do, I would start by looking at the distribution in Metrics.
For the same reason, I do not put alerts on counts. A "N or more" threshold on events squeezed to at most one per hour goes quiet while underestimating the impact. So this blog's verdict is whether it occurred at all. Rob Ewaschuk's My Philosophy on Alerting recommends alerting on the symptoms users experience rather than on causes, but that principle rests on the premise that the symptom shows up somewhere. This blog's failure hides behind a 200 response and a count of 0, so only by instrumenting the fact that the fallback ran does it become a symptom worth alerting on.
Features that require the browser SDK
Session Replay and User Feedback assume the browser SDK. This blog decided not to include that SDK, so the current verdict is "off", and the bundle cost reasoning is covered in part 2. Browser profiling also needs the SDK, is in beta, and comes with several conditions; what those conditions actually show is examined in part 3.
Features I did not run
According to the pricing documentation, Seer is a paid add-on that costs $40 per active contributor per month on top of a subscription. This time I considered running it on the Next.js internal InvariantError issue opened on September 11 (JIHOON-BLOG-A), but I did not, because it requires that subscription. I did not check whether this account has one. So this article contains no first-hand experience of Seer. Agent Tracing became generally available on September 11, 2026. It is an item that is easy to mislabel as beta if you rely on a model's memory or older articles, but this blog has no LLM call paths, so it does not apply.
What AI reduced and what it did not
The costs AI reduced in this work are clear. Gathering conditions from scattered docs (whether browser profiling is in beta, the headers, browser restrictions), learning query syntax and changing the group by, subtracting and adding breadcrumb timestamps, and drafting the feature table all finished in a few exchanges. For example, the breadcrumb timeline took one get_issue_breadcrumbs call, and confirming zero monitors took two calls, find_monitors and find_uptime_monitors. With a lower barrier to exploration, it became possible to first ask "what does the current data say" before judging "should I turn it on or not".
What it did not reduce is just as clear.
- Data that was never stored. 134 of the 144 events (as of 14:26 UTC on September 16) are gone, and spans dropped from the sample never existed in the first place. An agent cannot restore data that does not exist.
- Experiments that need a deploy. Whether gRPC calls are captured as spans, and telling freezing apart from event loop blocking, can only be known by actually adding instrumentation and deploying.
- Conditions for interpretation. The extrapolation warning and the fact that a local event was stamped production were not shown in the responses. I noticed them because I read the event's URL and server name myself.
- Lag between dates and tools. For features like Agent Tracing, whose status changed five days earlier, I had to open the changelog to confirm. The MCP tools are also still catching up with the product. Putting
ORinto an issue search returned 400, and the alert rule lookup tool returned 410This API no longer exists. - Deciding what counts as failure. Because the judgment to define a 200 response and statistics of 0 as failure, and to move the instrumentation point down, came first, there were events to reopen at all.
Closing
To sum up, the reason I left most of Sentry's features off was not a lack of knowledge but the cost of checking. AI lowered that cost considerably, and thanks to that my order changed to asking this account's data first before turning features on. The data I reopened that way showed a few uncomfortable facts before any new feature did. The outage I believed was fixed had only stopped without ever being fixed, the distribution from that time can no longer be redrawn because it passed the retention period, and my local verification was mixing into production issues.
So this blog's next steps were decided not by a feature list but by the gaps. Attach Crons to the weekly collection, choose signals for GA calls that are less shaken by retention and sampling, and start by fixing the local environment name. I hope readers of this article also think about the features they never turned on in a tool they have used for a long time. Whether that feature was truly unnecessary, or whether checking was simply expensive, is something you can now ask the data directly.
The next article moves to the place of the browser SDK this blog chose not to install, and looks at how to see what happens on a visitor's screen in Browser Observability.