Observability
In this post, I want to talk about observability.
I have used Sentry at work for a long time. When an issue appears, opening the stack trace, narrowing the scope with releases and tags, and finding the conditions for reproduction are all familiar tasks. Yet this blog had no error monitoring. What I had worked with on my personal blog were Google's tools: Analytics to see visitors, Search Console to see which queries brought them in, and then revisions to titles and descriptions based on that information. In other words, I had tools for seeing users, but none for seeing how the server failed.
It was not because I did not know the tools. I had postponed it for another reason. At work, I could build on instrumentation that someone had already installed. On this blog, I had to decide everything from scratch: which tool to use, whether to place it on the server or in the browser, and what to count as failure. Every choice was a design decision, and making those decisions meant first revisiting how this blog worked. Each time I reached that threshold, I pushed the work back again.
Then I began the work with an AI agent, and it was finished in a day. There were four merged PRs and two validation PRs that I closed without merging. But “it was fast” is not what made me write this post. What did was discovering, after instrumenting and measuring, that several things I believed I knew were wrong.
I thought this blog was working well. Responses were 200 and pages rendered properly. After adding instrumentation, however, I found that visitor statistics had already been silently empty, while the server hung for more than a minute in front of them. The value of adding an observability tool was not that the tool had been installed. It was learning things I otherwise had no way to know.
This post therefore follows two paths. One concerns service reliability, and the other understanding users. Both eventually arrive at the same point.
First, let us clarify what observability means
Monitoring and observability are often used interchangeably, but they refer to different things.
Charity Majors, a Honeycomb founder who has long shaped discussion in this field, explains in her blog that monitoring means deciding in advance what to check and setting thresholds: alert when CPU exceeds 90%, or when the error rate exceeds 1%. Observability, by contrast, is defined this way.
Can you understand what is happening inside the system—can you understand any internal state the system may get itself into—simply by asking questions from the outside?
can you understand what is happening inside the system — can you understand ANY internal state the system may get itself into, simply by asking questions from the outside?
Can you understand an arbitrary internal state the system may enter by asking questions from outside? The key is “arbitrary.” Monitoring predefines the questions to ask; observability is the condition of being able to answer questions that were not specified in advance. In another article, Majors describes the distinction as known-unknowns versus unknown-unknowns: what we know we do not know, and what we do not even know that we do not know.
What happened to me was exactly the latter. I had not asked in advance, “What happens if the GA call fails?” It had not occurred to me to ask.
One additional note: observability is often introduced as the “three pillars of logs, metrics, and traces,” but Majors herself has treated this framing critically in several articles. The official OpenTelemetry documentation also uses signal rather than pillar. If you assume collecting all three produces observability, it is easy to end up with every tool in place yet no answers to your questions. (I, too, began with a list of tools and changed direction at this point.)
Observability tools are very difficult to work with
What, specifically, made adding an observability tool difficult? Looking back at why I postponed it, there were two kinds of difficulty.
The first is having to understand how the browser produces values. This is especially true when observing the user's side from the frontend. To measure performance as visitors experience it, for example, you first need to understand PerformanceObserver. This API constrains which options can be combined. According to MDN, the buffered option, which retrieves entries that have already occurred, can only be used with type, not with entryTypes. Whether you place the script at the very top of the page can determine whether you miss the initial metrics altogether.
The metric definitions themselves also differ from intuition. CLS, which measures layout shifts, is not the sum of every shift on the page. The CLS documentation on web.dev defines it as the single largest cluster among session windows. Shifts less than 1 second apart belong to one cluster, and a cluster can last at most 5 seconds. Moreover, shifts within 500 milliseconds of user input are marked with hadRecentInput and excluded, because an accordion expanding after a user presses a button is not a defect. If you add the shifts yourself without knowing these rules, you get a different value and it is hard to see what went wrong.
The composition of the metrics changes as well. FID, which measured input delay, was replaced by INP on March 12, 2024. The metric shifted from looking only at the first response to a single interaction to measuring interaction responsiveness over the full lifetime of the page.
Of course, you need not calculate this yourself. You can use Google's web-vitals library. Still, its documentation describes pitfalls that remain even when using the library. These APIs cannot see inside an iframe, so pages with iframes can differ between values measured by the library and the Chrome User Experience Report (CrUX). CLS, FCP, and LCP are not reported at all for pages loaded in background tabs. Metrics are reported again after restoration from the back/forward cache. Thus, when a value differs from expectations, you ultimately need browser knowledge to distinguish a slow site from a measurement rule.
The second difficulty is deciding where to place instrumentation. The OpenTelemetry documentation explains this distinction clearly. It calls the agent-based approach that requires no source changes zero-code instrumentation, and describes its scope as follows.
Typically, zero-code instrumentation adds instrumentation for the libraries you use. This means that requests and responses, database calls, message queue calls, and so on are instrumented. Your application code, however, is not typically instrumented. To instrument your code, you need to use code-based instrumentation.
Typically, zero-code instrumentation adds instrumentation for the libraries you're using. This means that requests and responses, database calls, message queue calls, and so forth are what are instrumented. Your application's code, however, is not typically instrumented. To instrument your code, you'll need to use code-based instrumentation.
What automatic instrumentation gives you for free is the library boundary. It tells you that an HTTP request arrived and a DB call went out. It generally does not tell you what decision your application code made. You must add that by hand.
And the instrumentation I needed was precisely the latter. I needed to know not that “the GA client was called,” but that “this blog's statistics lookup function swallowed a failure and returned a default value.”
What changed when I used AI
So what did AI change? To be clear, I have no control group. I had never done the same work alone, so the number “one day” should be read not as a performance result, but only as evidence that the threshold for starting was lower. With that caveat, there were two changes.
One was that I did not have to memorize every rule above. Previously, when a value looked strange, half a day could disappear just determining whether my code or the measurement rule was responsible. Now I can bring the observed value itself and narrow things down by comparing “How is this metric calculated under these conditions?” with the documentation. Of course, it cannot be trusted blindly. While writing this post, I caught AI fabricating a plausible sentence that did not exist in the paper. I therefore checked every sentence used as evidence against the original source. Still, knowing where to look and memorizing everything are different problems, and the burden of the latter has clearly decreased.
The other change was reviewing candidate instrumentation points together. Listing candidates and exchanging reasons for why each should be used was faster than doing it alone. But the judgment of what counted as failure remained mine to the end. What follows is a record of that judgment being wrong.
It failed, but was reported as a success
The initial plan was simple. Add error reporting to the catch in the statistics API route handler. Then I would know whenever a GA call failed. It sounded reasonable.
But when I deliberately injected an invalid service-account key into a local production build, the error never reached the route's catch. Four catch blocks in the statistics lookup module one layer below caught it first and returned default values. Consequently, the response went out like this.
HTTP 200 OK
{ "slug": "/260610", "views": 0 }
Visitors see a statistic of 0, while the server says everything is fine. Without instrumentation, there is no way to know. (I discussed this layering in Error Handling. At the time I asked “Where should we catch it?”; this time I encountered “We caught it, and nobody knows.”)
So I moved the instrumentation from the route into those four locations and added tags that identify which query failed. Those tags become decisive later.
Asymmetry in observability
I had been calling this merely “a failure that does not look like a failure,” but discovered that it already had an exact name. It appears in the paper Gray Failure: The Achilles' Heel of Cloud-Scale Systems, presented by Microsoft and Azure teams at HotOS in 2017.
The paper says major availability incidents in the cloud are usually not complete stoppages. Recovery mechanisms based on a simple failure model—in which a component either works correctly or stops entirely—are inadequate in these situations and sometimes make them worse. It identifies their key characteristic this way.
We argue that a key feature of gray failure is differential observability: the system's failure detectors may fail to notice problems even when applications are affected by them.
we argue that a key feature of gray failure is differential observability: that the system's failure detectors may not notice problems even when applications are afflicted by them.
Differential observability is an asymmetry of observation. One party is harmed by a failure while another does not perceive it, and the latter is precisely the party responsible for detecting and recovering from failures. The paper gives a striking example: if the request-processing module has stopped but the heartbeat module remains alive, an error-handling module that relies on the heartbeat judges the system healthy, while the client requesting service judges it failed.
The paper also suggests a direction for solutions: focus on closing the gap between different components' perceptions of what constitutes failure. Moving instrumentation from the route to the lower layer did exactly that.
Then it caught a real incident
The first genuine production issue after adding instrumentation is the next scene in this story.
A GA call was failing with DEADLINE_EXCEEDED after 65.877 seconds. Because of the structure described above, the response was still 200. The home page is dynamically rendered and streams the statistics area, so the page itself appears immediately. Instead, that area remains loading for more than a minute, then quietly fills with 0.
Investigating the cause, I found this in the configuration file for the GA client library I use.
"RunReport": { "timeout_millis": 60000, "retry_params_name": "default" }The library's default RPC timeout is 60 seconds, and my code did not override the timeout at any of its five call sites. At the time, I interpreted the observed 65.877 seconds as 60 seconds plus connection and load-balancer overhead. (That interpretation is challenged later, as I will explain.)
What I learned was that this was not a mistake unique to me, but a widely warned-about class of error. The official gRPC blog post on deadlines by Google SRE's Gráinne Sheerin begins under its title with “TL;DR: Always set a deadline.” It explains that without a deadline, every in-flight request can hold resources until the maximum timeout, exhausting memory, increasing latency, and in the worst case killing the process. The GA client I use is also based on gRPC. The documentation had already warned about the same principle, but I failed to apply it at the call sites.
The fix was to set the timeout to 5 seconds and pass it to all five call sites. I then set up an unresponsive local TCP server for a decisive reproduction.
| Condition | Elapsed time | Error message |
|---|---|---|
| Timeout unspecified (before fix) | 60.04 seconds | Deadline exceeded after 60.000s |
timeout: 5000 (after fix) |
5.00 seconds | Deadline exceeded after 5.000s |
The numbers behaved exactly as described. Only after obtaining this table could I say I had confirmed that the timeout configuration actually reached the code. (Before then, “It must be because there is no timeout” was merely a guess. Later, however, it became clear that this did not confirm the production cause.)
One more point: the number 5 itself has no evidentiary basis. I had not measured the response-latency distribution when GA was healthy, so 5 seconds was effectively arbitrary. But the direction of the decision had support. In Chapter 3, Embracing Risk, the Google SRE book says 100% is never the right reliability target: it is unattainable and usually more reliable than users need or can notice. Visitor counts are supplemental information on this blog. Giving up quickly and rendering a default is better for visitors than retrieving the exact value. In effect, I decided not to set the reliability objective at 100%.
I measured again after thinking it was fixed
This was supposed to be the original ending of the post. I had found the cause, reproduced it, and fixed it.
But while writing, I reopened the issue list out of habit. In the release containing the fix commit, more than a hundred DEADLINE_EXCEEDED events from the same family had accumulated. The most recent was only hours old.
I pulled the latest 100 events and examined the distribution of reported durations. One distinction matters: this value is not how long GA actually spent responding. It is wall-clock time from the moment the deadline timer was set until the moment that timer actually fired. This distinction becomes important below.
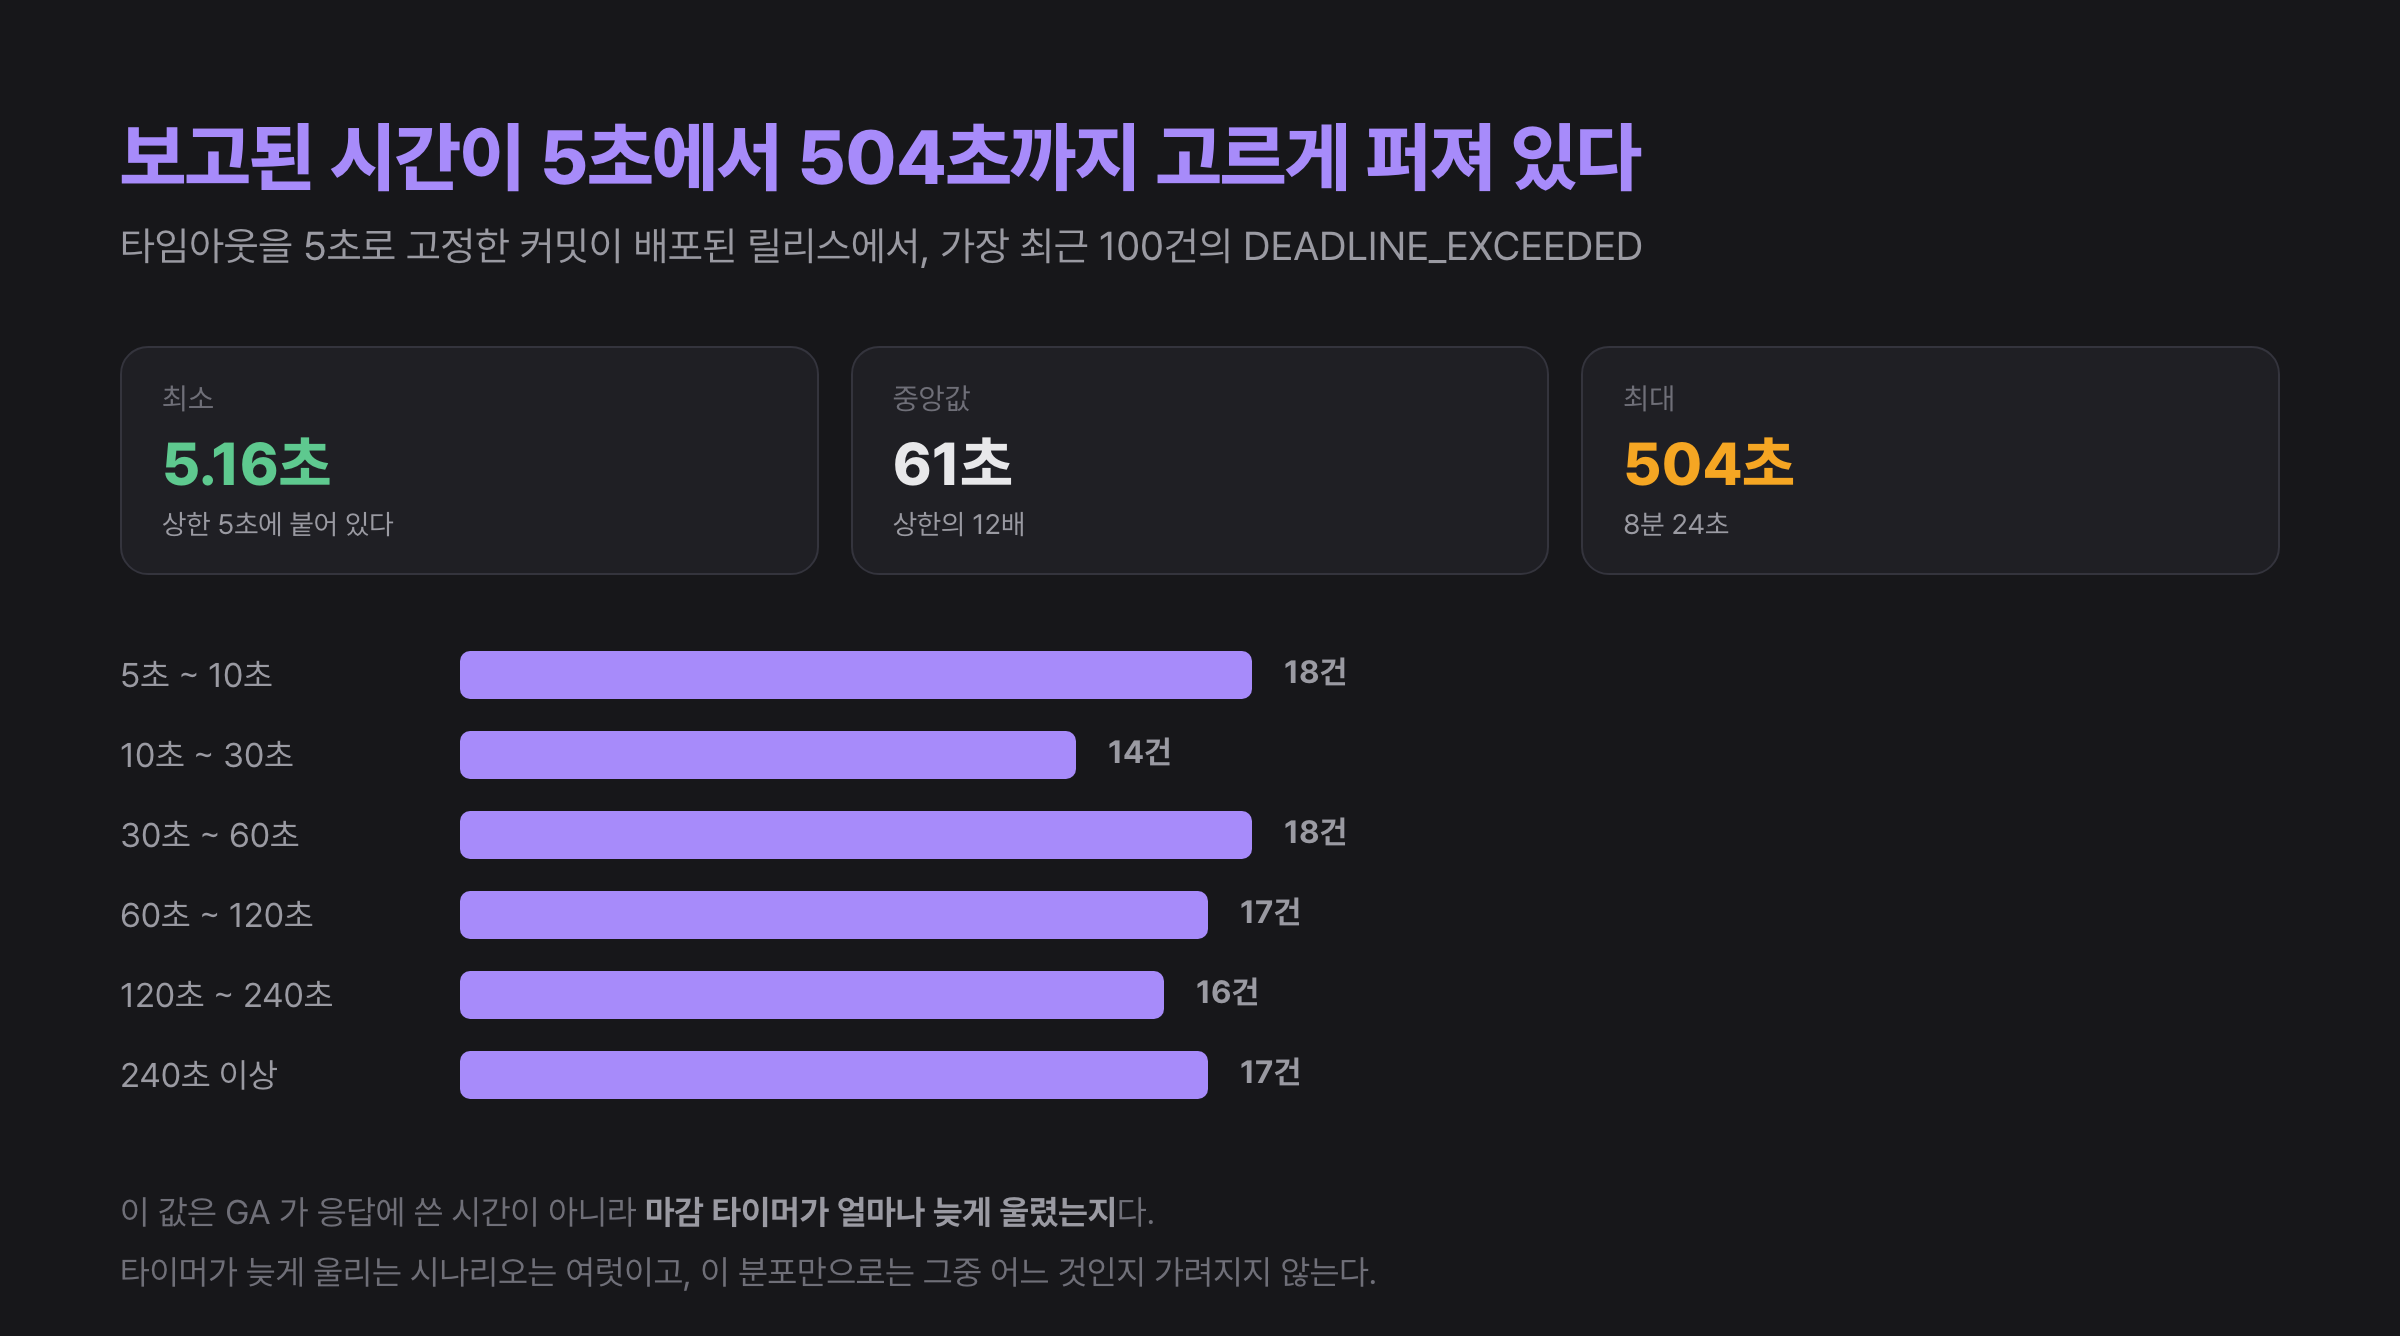
Here is how to read it. The lower bound held. Not one event ended before 5 seconds; the shortest was 5.16 seconds. Compared with the 60-second reproduction when the limit was not overridden, the 5-second setting itself was reaching the code. Yet the upper end extends to 8 minutes 24 seconds, and the median is 61 seconds. Stranger still, the values do not cluster anywhere. If actual GA slowness caused the delay, they should collect near the upper bound, but they do not.
The tags revealed more. The only tags among the 100 events were stats and popular, usually arriving in pairs. These two paths share one property: both are revalidation paths behind a one-hour cache. By contrast, the other two paths (page, pages), which accept an uncached request and call GA in place, never appeared among the 100 events.
That matters. It means the failures happen not while handling a visitor's request, but only while refilling the cache after the response has completed.
And this observation undermines a sentence I wrote in the previous section. I said the statistics area remained loading for more than a minute, but if failures occur only on a post-response path, the visitor may never have waited that time. The first request with an empty cache would be different, but the data I have cannot distinguish the cases. I had written one more sentence without measuring it.
There is another concern. Earlier, I interpreted 65.877 seconds as a 60-second timeout plus overhead. When I reopened the overhead fields on that event, however, they totaled only about 2 milliseconds. In retrospect, that interpretation was also weakly supported. The same kind of inflation may have been present then.
My current hypothesis is this. This blog runs on serverless functions, and after a serverless function sends its response, its execution environment freezes until the next invocation. If timers freeze with it and fire late when the function wakes, the recorded wall-clock value can be inflated rather than representing time actually spent waiting. That would explain both the lower bound sitting exactly at 5 seconds and the absence of clustering in the upper values. It also fits the earlier observation that failures appear only in post-response work.
But another caution is necessary. A distribution not contradicting a hypothesis is different from supporting it. Many scenarios cause a timer to fire late. Besides a serverless freeze, heavy rendering might have occupied the event loop, or the container might have throttled CPU. All three produce the same shape of distribution I observed, so this graph does not narrow the candidates.
I am also keeping another explanation in consideration. The library configuration sets a total budget of 600 seconds including retries, and the observed maximum of 504 seconds falls within it. Yet the list of retryable codes for this method is empty, so I read the method as not taking that path. Either way, the hypothesis remains unverified. Choosing how to verify it brought another trap. My first thought was to measure the times immediately before and after the call, but that would not answer the question. Wall-clock time continues to pass while the function is frozen, so it would merely reproduce the number I already have. What distinguishes the possibilities is CPU time over the same interval. If 61 seconds of wall-clock time pass while CPU time is nearly 0, the function was not waiting; it was stopped. That is likely the next task.
There is a reason I deliberately left this section in. I believed I had fixed the problem. I had reproduced it and even made a table, so I considered it certain. When I opened it again, it was not. Adding instrumentation is a one-time task; observability means continuing to measure. Confusing the two leads to exactly the mistake I made.
One additional detail: I did not obtain the issue list, tag distribution, and timing values above by opening the dashboard. I asked the agent. Sentry offers an official MCP server; when connected, it lets you query issues and events directly from the editor. I could place production issues alongside the code without several rounds of clicking. The cost of inspecting accumulated data has fallen, not only the cost of adding instrumentation.
Installing it and using it are different things
After reaching this point, I did one more thing: reread the tool's documentation from the beginning to learn the limits of what it could do. The decisive detail in this investigation was ultimately one tag, something I had added almost casually while instrumenting. If a casual tag was that valuable, what questions could the features enabled deliberately answer?
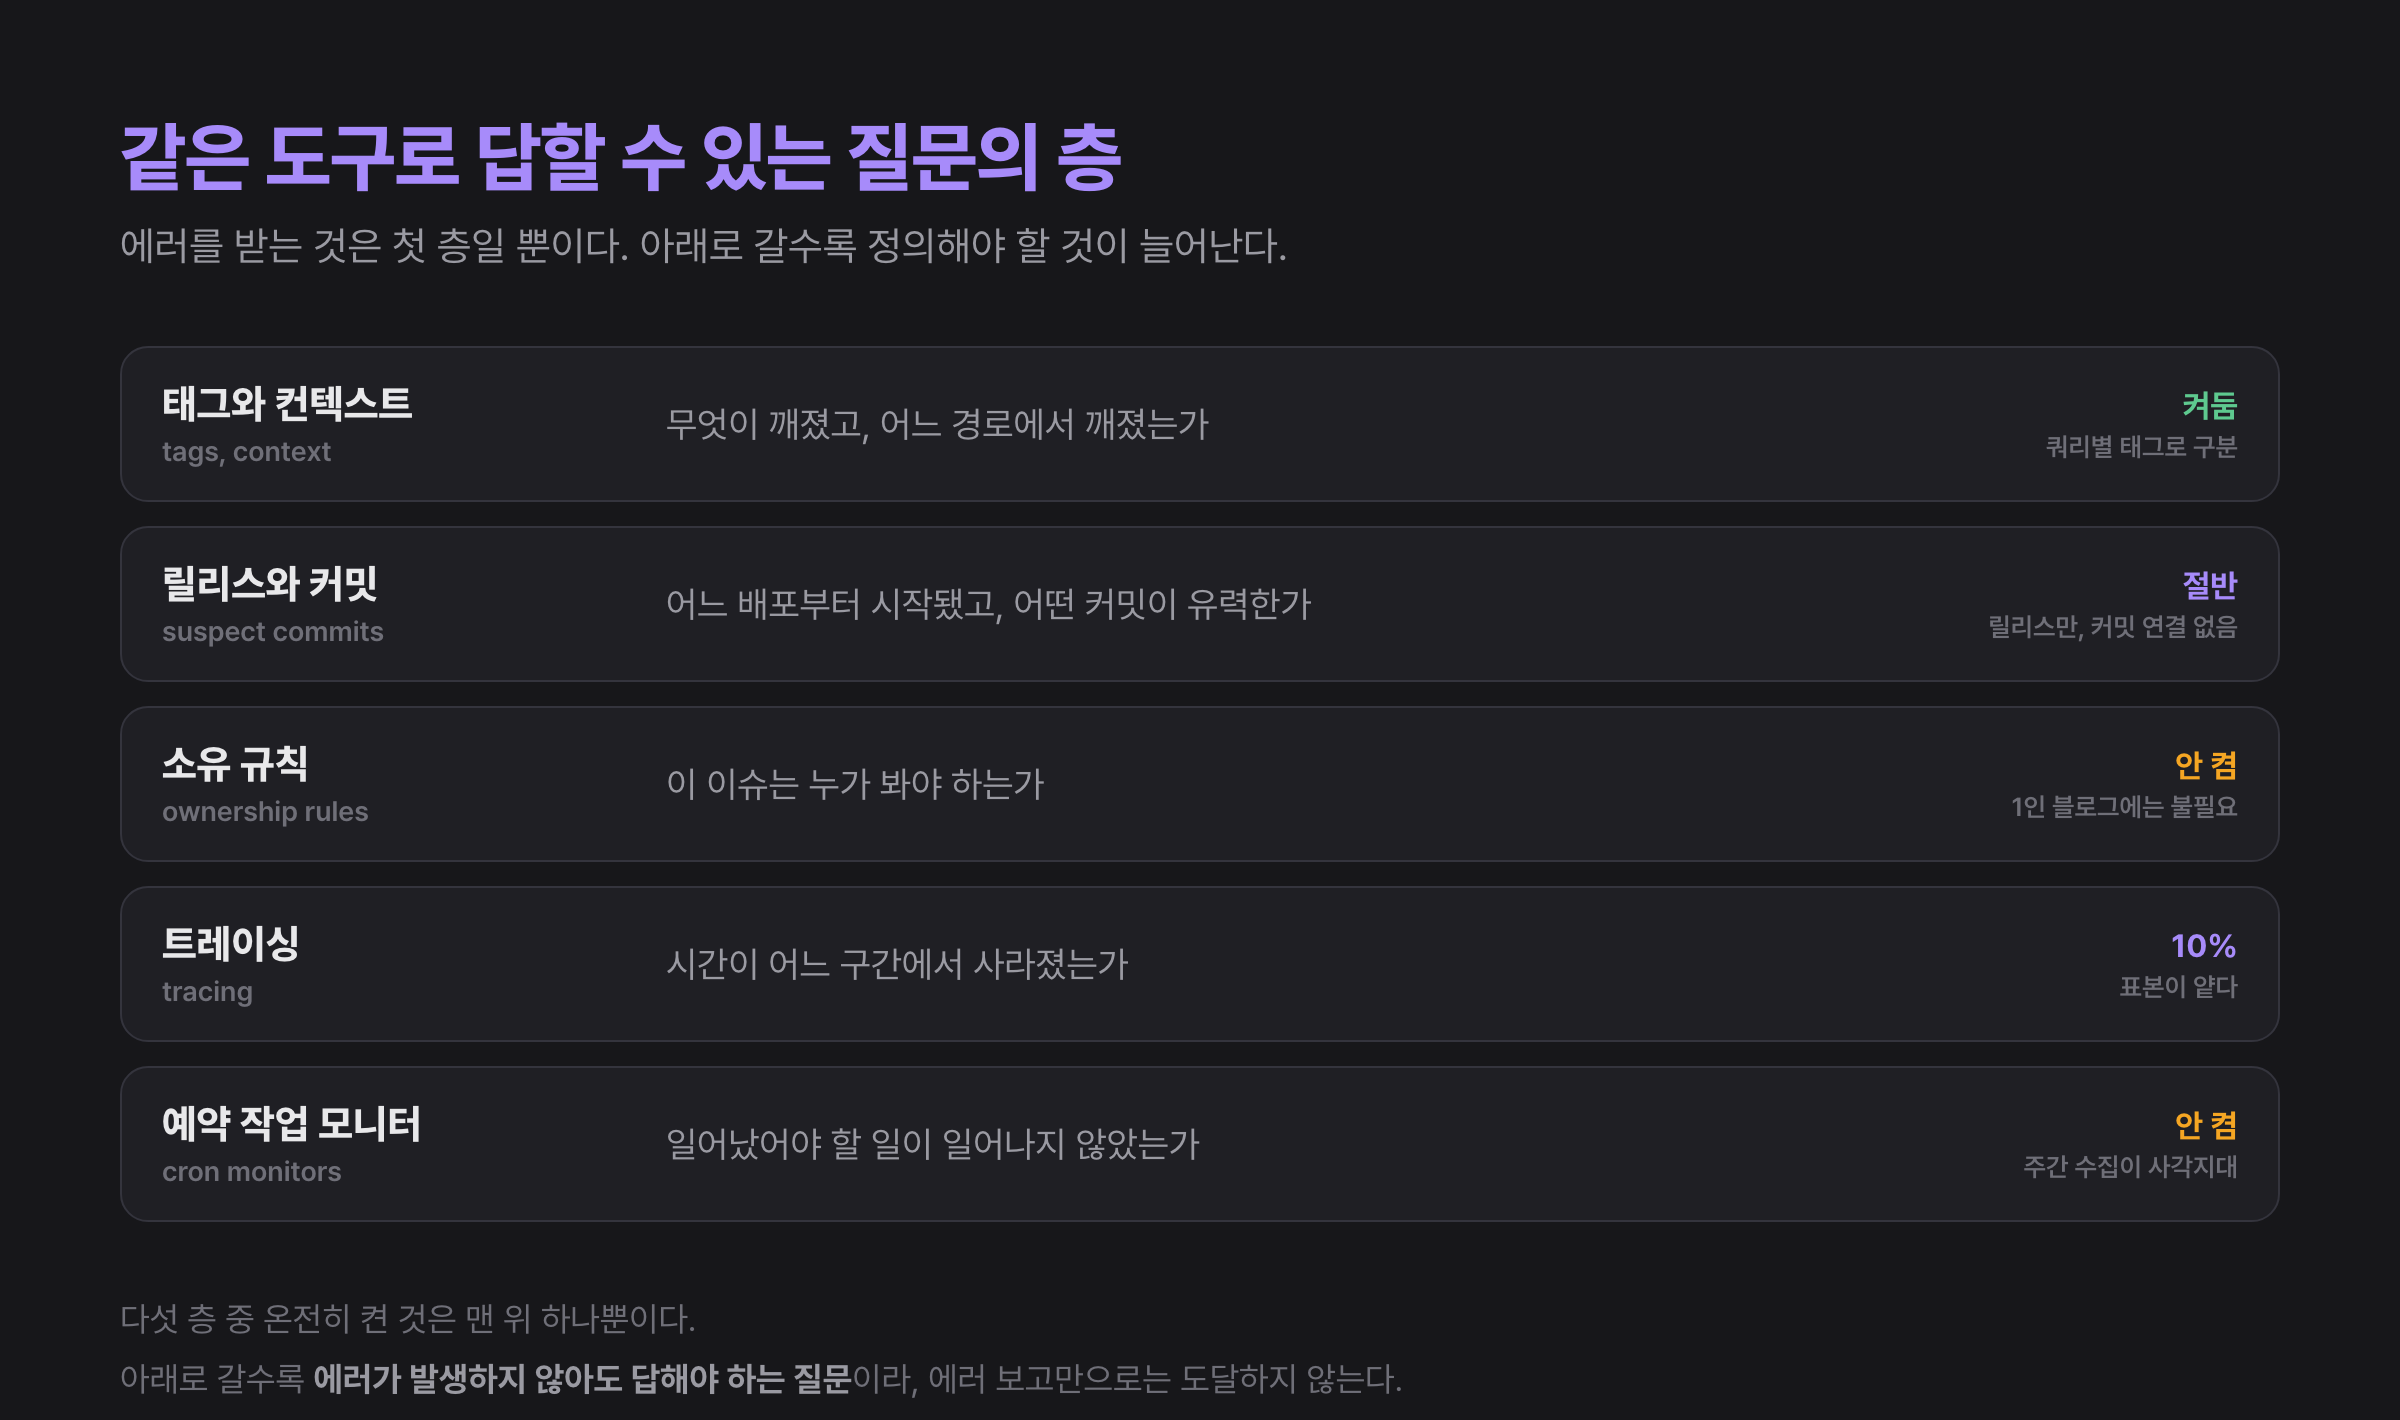
Releases and commits are the first layer. This blog attaches the deployment commit hash as the release, so I know which deployment first introduced a problem. One step further is to upload the commit list with the release, enabling suspect commits. It checks blame information for each application frame in the stack trace by file and line, and names the latest commit as a suspect if it is less than a year old. It then proposes that commit's author as the assignee or even assigns them automatically. Associating commits with a release can also mark an issue as resolved in that release from an issue ID in a commit message. This blog already uploads source maps, so half the foundation exists, but I had not linked commits.
Ownership rules have little use on a personal blog, but their structure is interesting. The documentation shows how Unix globs can match file paths, modules, request URLs, or particular tag values to assign an owner or team: path:src/api/* goes to the backend team, for example. My first thought was that this is not an alert-routing feature but a mechanism for expressing ownership as code. If a person must decide who should inspect each issue whenever it appears, on busy days nobody does.
Tracing answers a different kind of question. The Sentry documentation defines a trace as a record of connected events and operations from an application, and a span as one named, timed operation. It follows a request across services, databases, and functions to see how much time each segment consumed. If error reporting answers “What broke?”, tracing answers “Where did the time disappear?” The point where I got stuck in the previous section was exactly the latter. To determine whether reported elapsed time was actual waiting, I needed the beginning and end of the call segment. To control costs, this blog sampled only 10% of traces, a decision I regretted here.
And scheduled-job monitors are the card that best matches this post's argument. Error reporting only catches things that happened. It cannot catch something that did not happen. A Cron monitor signals that a job is in progress when it starts and reports success or failure when it finishes. The important part is its third state. The documentation separately classifies a missing signal at the scheduled time as a missed run. This includes cases where the scheduler is misconfigured or the job never starts.
This was directly relevant to me. Every Monday, this blog automatically collects Search Console data. An entire observability layer discussed below rests on that job. Yet if the job silently fails to run one week, I currently have no way to know. It did not fail—nothing happened—so there is no error. The mechanism collecting observability data itself had a blind spot.
To summarize: installing a tool can take a day, but expanding the questions it can answer remains ongoing work. Which layers to enable is not determined by scanning a feature list. You must first decide what counts as failure before you can know which layer you need. For this blog, the moment I recognized “the weekly collection did not run” as a failure, another layer became necessary.
When an option does not do what its documentation implies
There is one tangential example I want to record. Its character is somewhat different.
After uploading source maps, I needed to remove the .map files from the build output because of their size. The server source maps were 57MB, larger than the server JS (15MB), and leaving them would include all of them in the deployed function bundle. Conveniently, there was an option to delete source maps after upload, so I enabled it.
But measurements showed that the 57MB of server .map files remained immediately after the upload. The option deleted only the static output directory and did not touch the server directory consuming the space. In the end, I changed it to specify the deletion paths directly.
For the same reason, I made upload logs conditional rather than suppressing them unconditionally. If logs are always disabled, an expired token can cause the entire upload to fail silently, and nobody knows until the next unreadable stack trace appears.
This is not a failure-detection problem, but a mismatch between a name and its actual behavioral scope, so I do not group it under gray failure. The lesson nevertheless points the same way: reading the documentation and enabling an option is different from verifying that the option did what you expected.
Errors are not the only things to observe
That concludes the reliability side. But the value of handling observability data well does not end with catching incidents. Let us move to the other path mentioned at the beginning: understanding users.
OpenTelemetry's definition of reliability captures this transition well. Reliability answers whether “a service is doing what users expect it to be doing.” The standard is not a server metric but user expectations. If so, we must also measure what users actually experience.
This blog ultimately observes three layers.
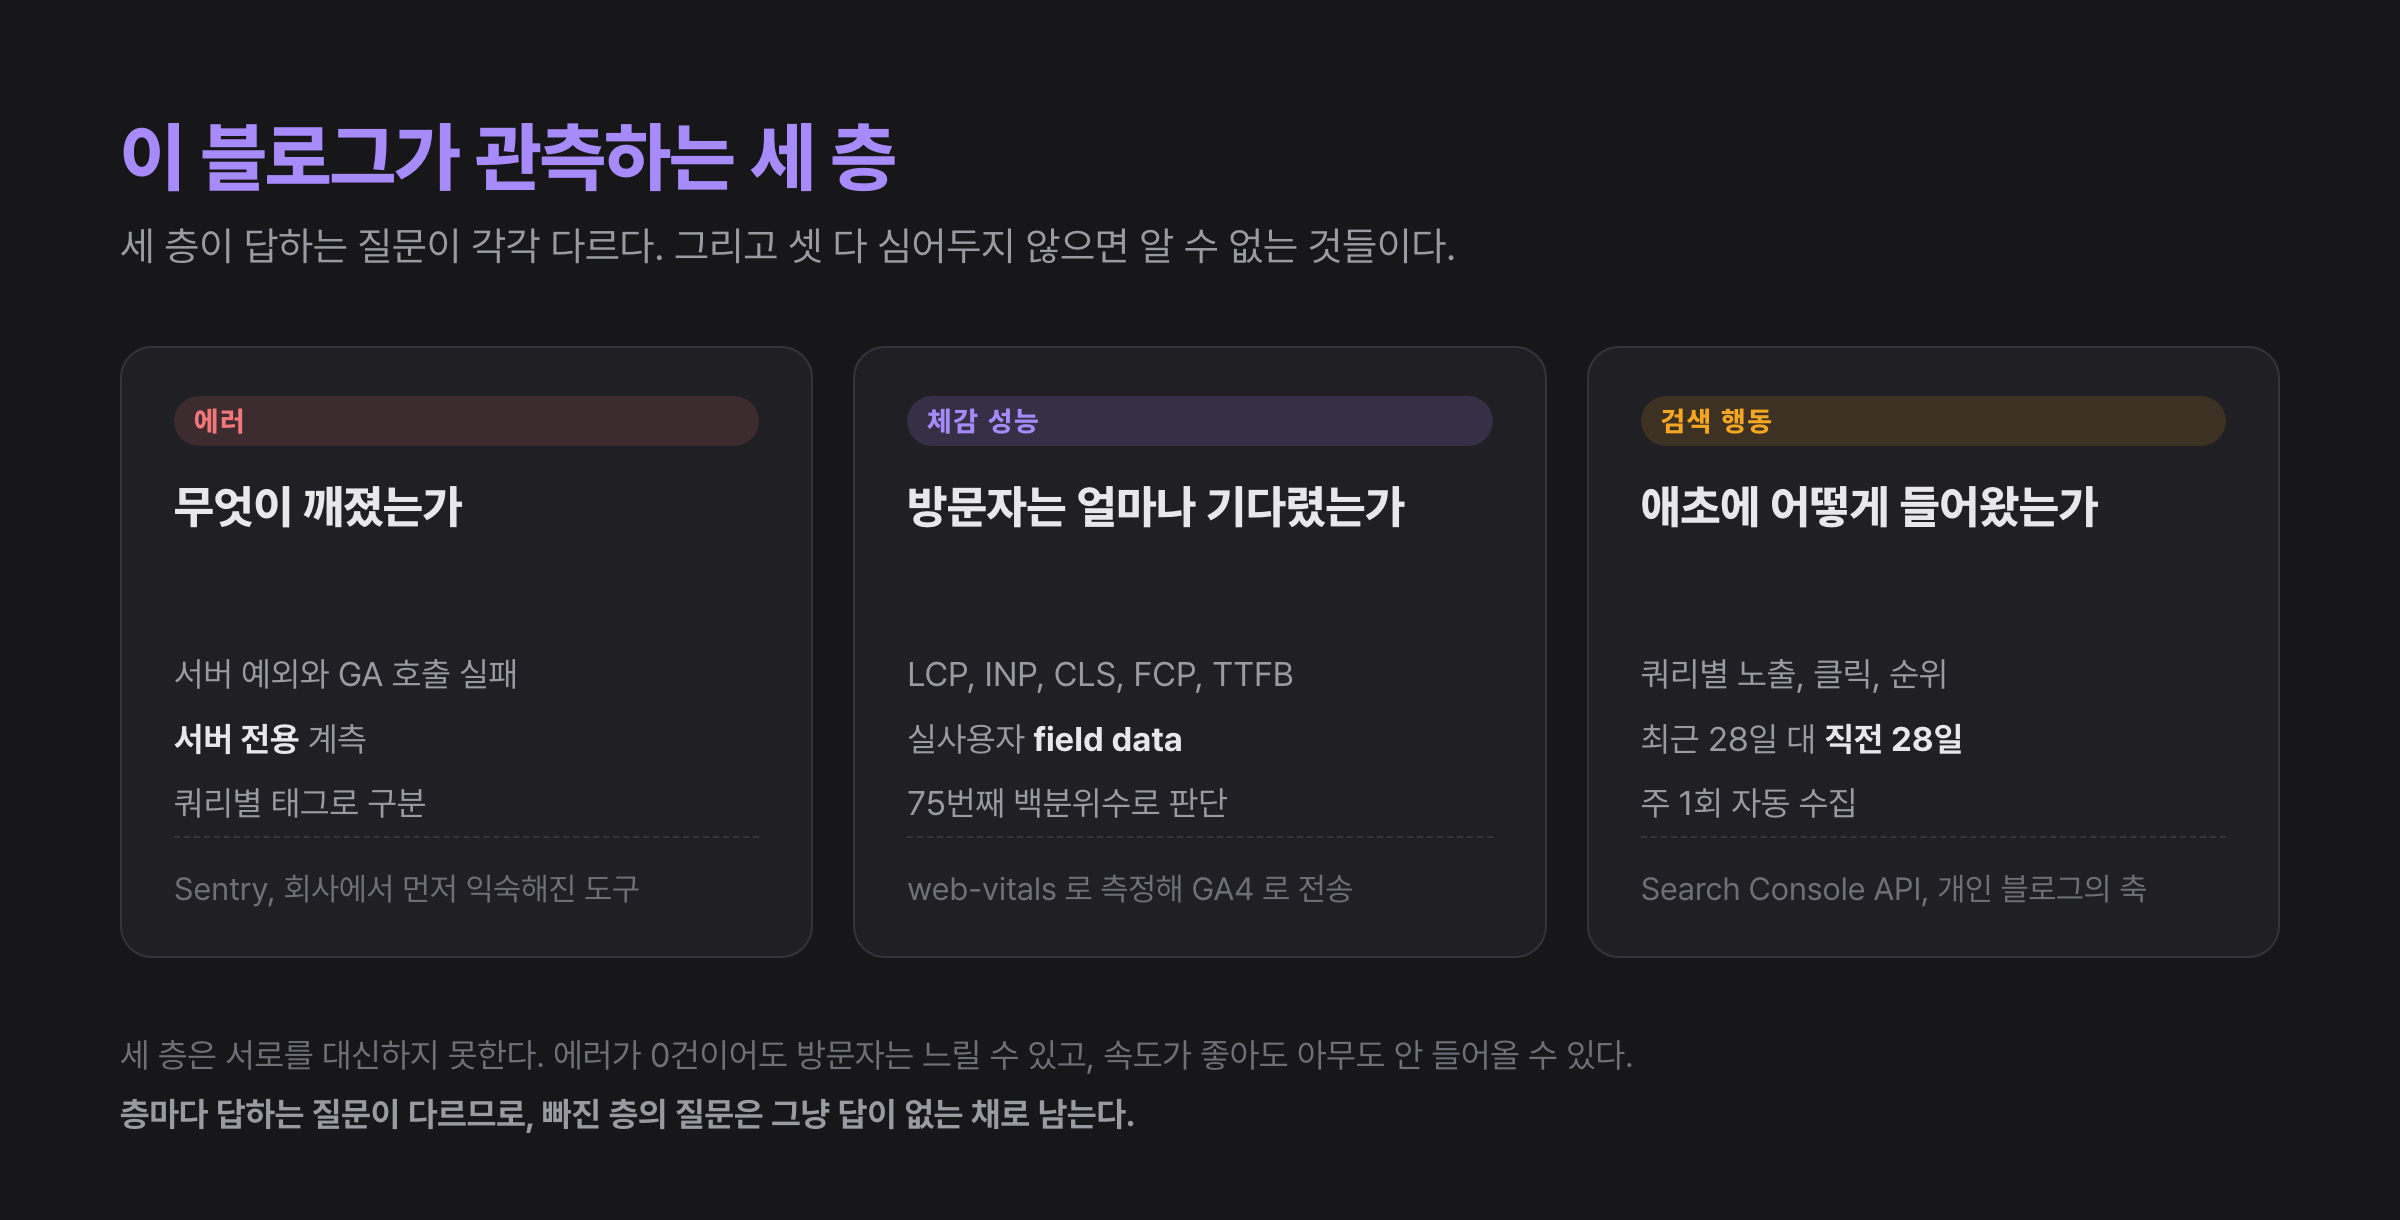
Each layer answers a different question. The first says what broke, the second how long visitors waited, and the third which search queries brought them in to begin with.
There was one important choice in the second layer. Performance metrics can be measured either by opening a page in a controlled environment or by observing every real visitor. web.dev calls the former lab data and the latter field data, and recommends using field data for prioritization when both are available in its comparison of the two, because field data represents what actual users experience. Even with a good Lighthouse score, the distribution among real visitors can differ. This blog therefore goes beyond checking a score and sends real-user values to GA4.
The baseline comes from web.dev's Web Vitals documentation: LCP within 2.5 seconds, INP at or below 200 milliseconds, and CLS at or below 0.1, evaluated at the 75th percentile of page loads separately for mobile and desktop. In other words, it examines the boundary exceeded by the slowest 25%, not the average. (Only after understanding this standard did I realize that an average erases slow users altogether.)
Rankings fell, but clicks increased
The third layer, search data, overturned my expectations once more.
This blog periodically collects Search Console data and compares the latest 28 days with the preceding 28 days. One old post stood out in the accumulated data.
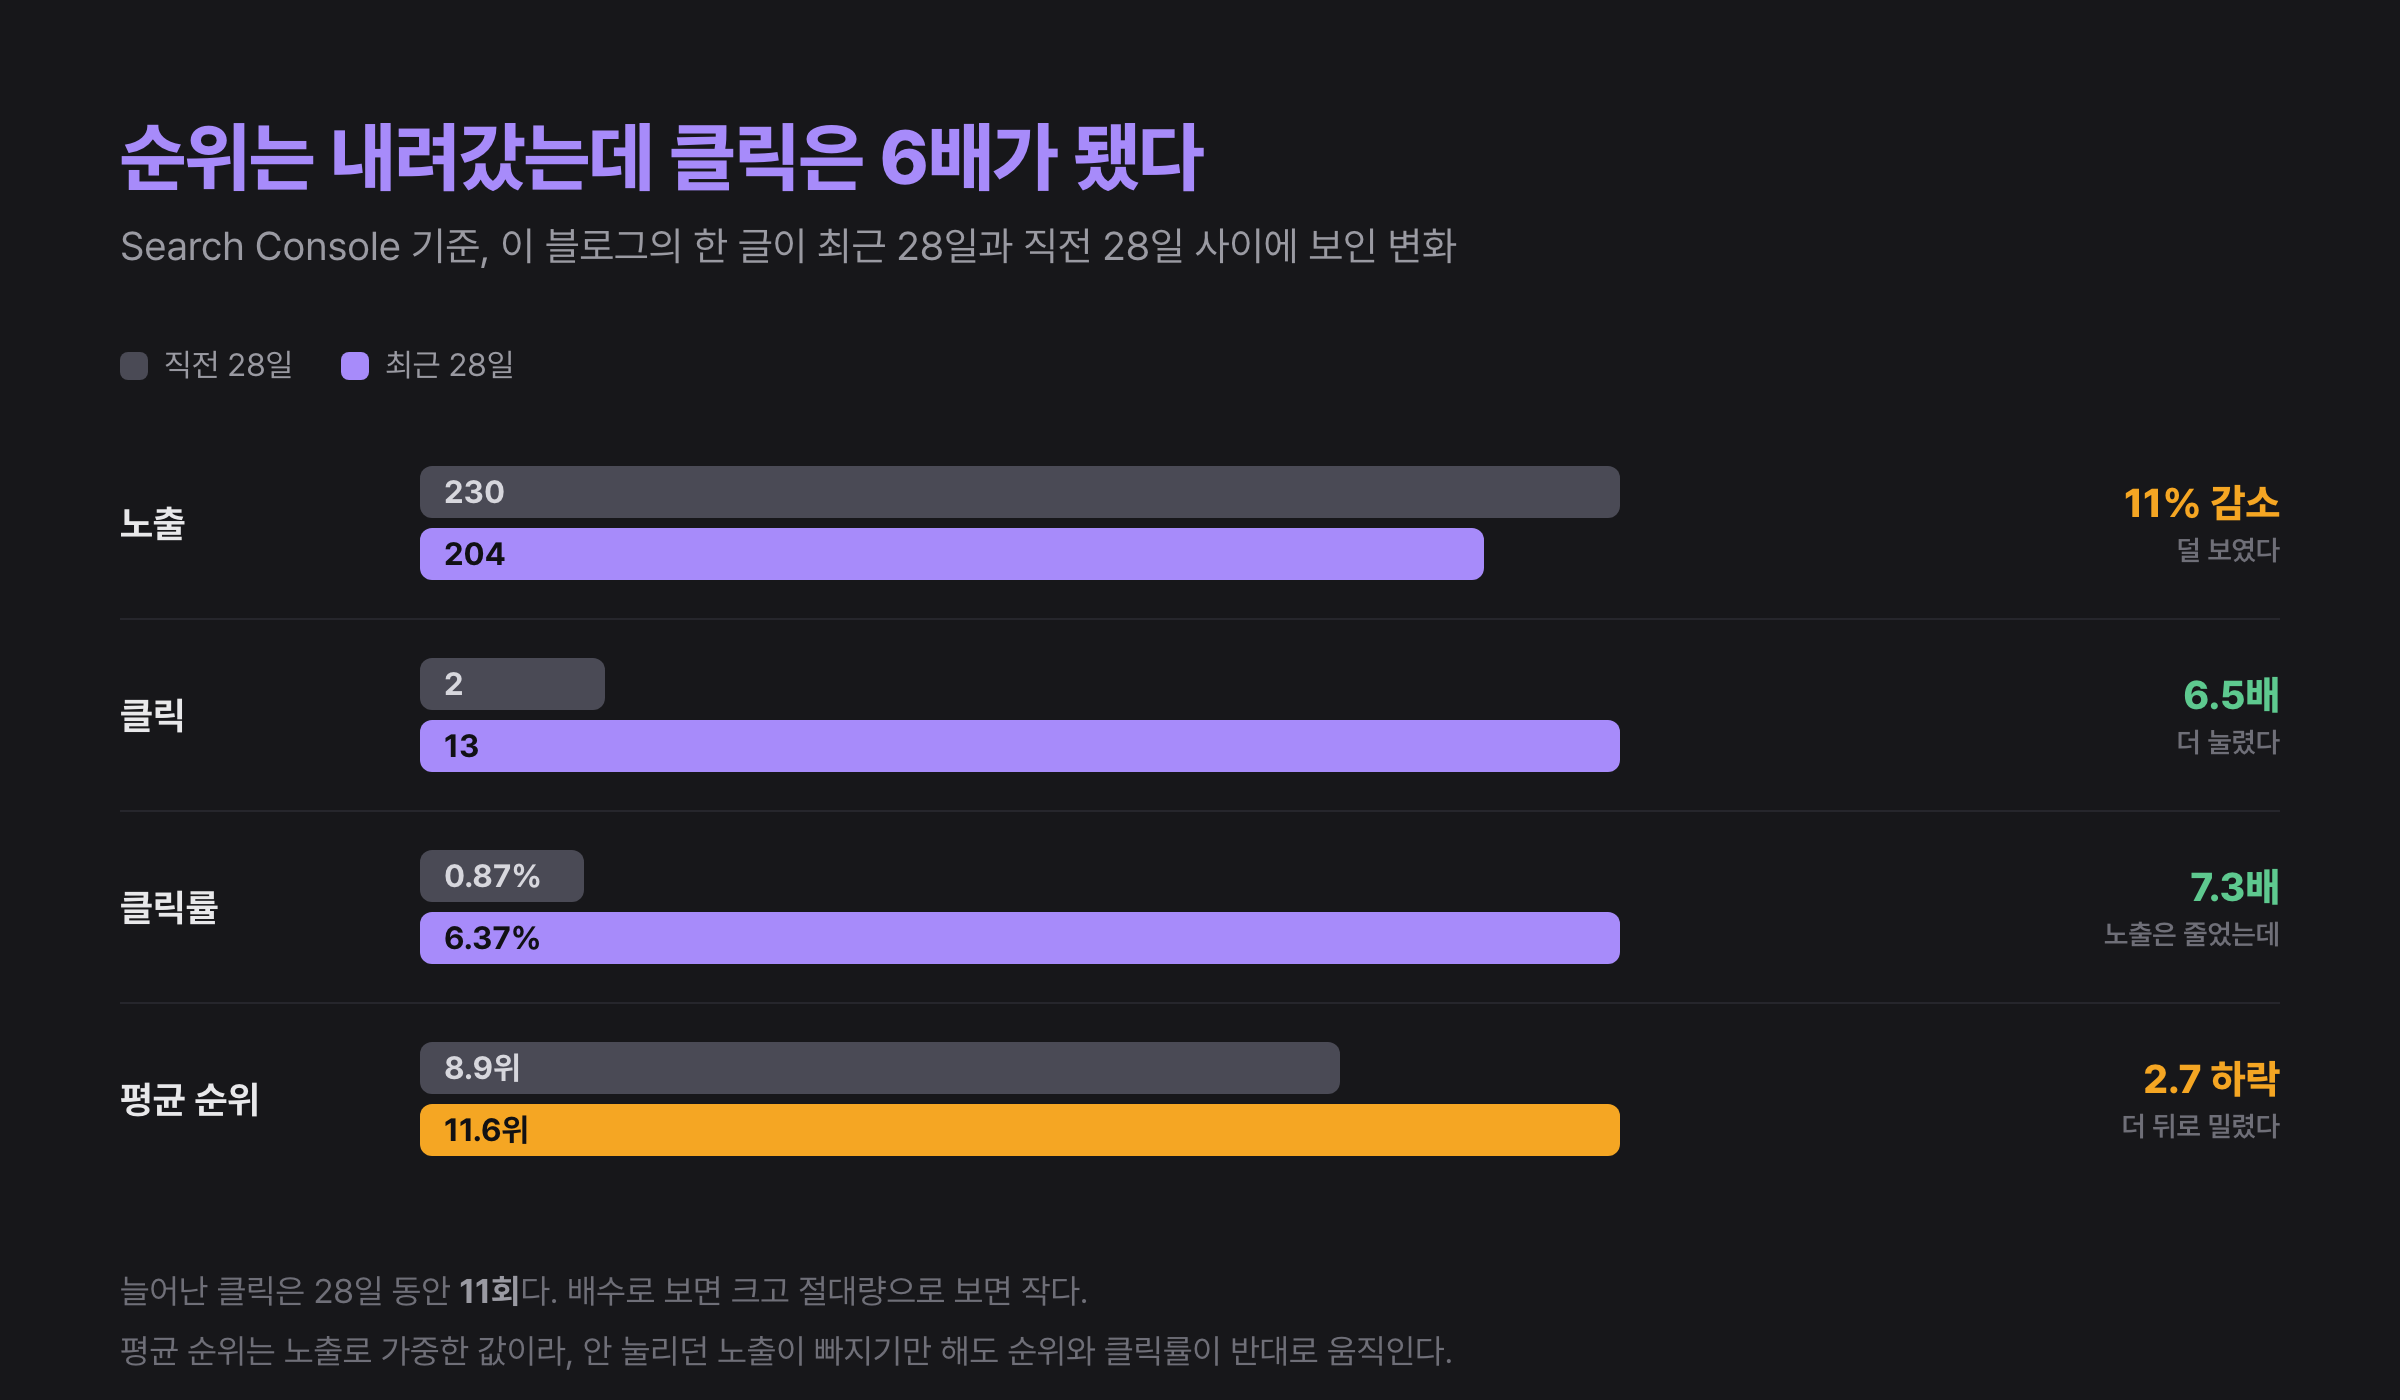
Impressions fell by 11%, and average position slipped from 8.9 to 11.6. Looking only at those two metrics, the post had worsened. Yet clicks rose from 2 to 13, and click-through rate moved from 0.87% to 6.37%.
It is only honest to deflate the excitement first. This pattern is familiar to anyone who has worked with search data. Average position is weighted by impressions, so if high-position impressions that nobody clicked disappear, average position worsens and click-through rate rises mechanically. A change in query mix alone can look like a reversal. And the absolute increase was 11 clicks over 28 days, a small number.
Even after accounting for that, something remains. More people reached this post, and I would not have known by looking only at impressions and position. What I learned from the figures was not a conclusion about one post, but that the metric you choose can reverse the conclusion. If ranking were the outcome, this post would need work; if clicks were the outcome, it succeeded. This is the same point as the reliability definition above: when the standard is placed on the user's side, what you see changes.
I have long revised titles and descriptions on this blog, rewriting search-result copy to match actual queries. These figures do not prove that work caused the improvement. Other factors, such as seasonality or a change in query mix, could readily explain a higher click-through rate despite a lower position. But without measuring, I would not even have known that a change in this direction occurred.
The decision to give up 79KB
One decision cannot be omitted from the three-layer story: not adding browser instrumentation.
I wanted to enable client error monitoring too. Continuing to miss errors that occur only in the browser bothered me. So I enabled it and measured the bundle. These are the gzip totals for client JS from clean builds.
| Configuration | client JS (gzip) | Increase |
|---|---|---|
| Not enabled | 181.6 KB | Baseline |
| Server-only (current) | 182.3 KB | +0.7 KB |
| Client included | 260.4 KB | +78.8 KB |
Server instrumentation was effectively free, but browser instrumentation demanded 78.8KB. I also tried bundle-optimization options, but the numbers did not change. The only way to reduce the client cost was to omit the browser initialization file entirely.
In retrospect, this measurement also has a flaw. Turning on an option without reducing even one byte might signal that the option did not work, but at the time I read only toward the conclusion. The figure is the sum of all static output, not what one visitor actually downloads. More precisely, therefore, I should write not “browser observability costs 79KB,” but “with my configuration, I could not bring it below that.”
The purpose of this blog's adoption was to catch calls that failed silently on the server, and that part was free. On this blog, loading performance is both user experience and a prerequisite for search visibility, so I gave it up. The interesting part is how the decision connects to the previous section: when reliability is defined by user expectations, more detailed observability is not always the right choice. Observability itself can diminish user experience.
But this seems to contradict my regret about reducing trace sampling to 10%. Both decisions reduced observability because of cost; why regret one and approve the other? The criterion I reached later was who pays that cost. Reducing trace sampling saved my bill, while the extra 78.8KB of browser instrumentation costs visitors data and time. When I bear the cost, buying more is usually better. When users bear it, I must ask what that observability gives back to them.
What should trigger an alert?
Once instrumentation is installed, the next question follows immediately: what should trigger alerts?
An early Google SRE document by Rob Ewaschuk, My Philosophy on Alerting, states that a page to a person must be urgent, important, actionable, and real. It recommends alerting on symptoms rather than causes: outward signals such as 500 responses or user-visible errors.
Yet there is a subtle tension between that principle and my experience. My symptom was not a 500. It was a 200 with empty statistics. Symptom-based alerting assumes failure is visible in a status code; differential observability is precisely the situation that breaks this assumption.
I therefore do not think the principle should be rejected. Instead, I concluded that defining what counts as a symptom is the truly difficult part. On this blog, the symptom was not the status code but “the statistics lookup function returned a default value,” and it could become a symptom only through hand-written instrumentation.
Another recommendation in the same document is worth remembering: lean toward deleting noisy alerts, because over-monitoring is harder to solve than under-monitoring. For reference, the SRE book includes monitoring failure itself among the triggers for writing a postmortem. My decision to retain conditional logs so source-map uploads could not fail silently pointed in the same direction.
Why this matters more in the age of AI
At this point, one question arises naturally. Is this not simply an argument for installing observability tools well? What does it have to do with AI?
I think it has a great deal to do with AI, for two reasons.
First, industry data says so. The 2025 DORA report, led by Nathen Harvey and Derek DeBellis, draws on a survey of roughly 5,000 technology practitioners worldwide and more than 100 hours of qualitative data. It reports a positive relationship between AI adoption and both throughput and product outcomes, then immediately adds this sentence.
However, AI adoption continues to have a negative relationship with software delivery stability.
However, AI adoption does continue to have a negative relationship with software delivery stability.
In other words, the relationship with delivery stability remains negative. Speed increases, but so does instability. In a separate insight article, DORA explains the mechanism this way: time saved during generation is reallocated to verification overhead, while the rate at which code requiring review is created also rises. The same report's summary captures the situation best: AI does not fix a team; it amplifies what is already there. If deployment speed alone rises where observability is absent, what gets amplified is silent failure.
Second—and this weighed more heavily on me—there is evidence that our subjective sense cannot be trusted. A 2025 METR study gave 246 real issues to 16 experienced open-source developers and randomly assigned, per issue, whether AI use was allowed.
When developers are allowed to use AI tools, they take 19% longer to complete issues…
When developers are allowed to use AI tools, they take 19% longer to complete issues…
What truly stands out comes next. The developers had predicted beforehand that AI would make them 24% faster, and even after experiencing the slowdown, they believed they had been 20% faster. I cited this research when writing AI Frontend Engineer, then read it in the context of productivity. I read it differently now. The result is not evidence that we should not use AI; it is evidence that perception diverges from reality.
And if perception cannot be trusted, only one method remains: measure. I felt that this blog worked well, but measurement showed a GA call hanging for more than a minute. I felt it was fixed, but measuring again showed it was not over.
The scope of observability is expanding too
Finally, I want to note one recent trend.
The objects we need to observe are changing. OpenTelemetry is organizing semantic conventions for generative AI in a separate repository, and instrumentation now covers not only GenAI clients but MCP (Model Context Protocol) calls. It is still early, with the schema still being refined, so I do not think it is ready for a general recommendation. The direction is nevertheless clear: as we begin connecting tools to AI agents, those calls also become objects of observability. I discussed how MCP works in AI Agent Tools and evals in Harness(Systems) Engineering; this seems to be where the two meet.
Error-monitoring services are moving in the same direction. Sentry offers an AI debugging agent called Seer, which it says combines issue details with trace, log, and profile context to find root causes and even create a fix PR. I have not used it seriously yet, and I could not find official accuracy figures in the documentation, so I cannot make claims about performance. It is clearly moving in the same direction as my experience of opening issues through MCP: the cost of interpreting observability data is falling.
Closing thoughts
To summarize:
Working with AI genuinely lowered the threshold for adding observability tools. A task postponed for a long time was finished in a day, and knowledge burdens such as understanding how the browser produces metrics are smaller than before. Yet what I gained was not a tool. It was the realization that all my assumptions were wrong: that catching only the route's catch was enough, that an option named a certain way would do that job, and that adding a timeout meant the work was finished. None of these could be known before measuring.
I therefore came to understand observability this way. It is a tool for finding a cause when an incident occurs, but before that it is a tool for measuring the gap between my perception of a system and its reality. To borrow the language of the Gray Failure paper, it is the work of closing the gap between what different parties perceive as failure. That gap exists both in reliability and in what users actually experience.
As generation becomes cheaper, this gap is likely to widen. The speed of making things rises, but the speed of checking them does not necessarily keep pace. That is why I now think observability is necessary if I want to use AI more actively. The order may seem reversed, but once we can build quickly, we must also be able to verify quickly.
Of course, these observations come from the small scale of a personal blog. Different traffic and team sizes will lead to different decisions. Another service might rightly make the opposite choice about the 78.8KB. This does not seem like a domain with one correct answer. But I think I can say one thing: feeling that a system works well and it actually working well are different, and measurement is the only way to know the difference. I hope readers will consider what they believe about their services without having measured it—and what they believe they fixed but have never reopened.