LLM Calibration and Overconfidence
In this post, I want to talk about model calibration and the overconfidence that shows up after RLHF. This is for developers who want to use the probability or confidence a model returns as a decision criterion in code. By the end, you will be able to explain how accuracy and calibration differ, what ECE measures, how the probabilities of a model polished on human preference drift from its actual hit rate, and how much of the cause is actually known.
I had to sort out these concepts first while testing the claims of Jev, a decision model released by TypeSafe AI. Instead of sentences, Jev returns a probability for each option, and it puts calibration forward as its training objective. To weigh that claim, I first needed to know what calibration is and why it drifts in existing models.
Accuracy and calibration
First you have to separate accuracy from calibration. Accuracy is what percentage you get right; calibration is whether you know what percentage you will get right. If you gather only the days a forecast said a 70% chance of rain and it actually rained seven times out of ten, that forecast is well calibrated. That does not mean it is accurate. It means it knows its own limits. A model that gets only 60% right scores full marks on calibration if it says 60% about itself.
The scale can drift in two directions. When the probability a model states is higher than its actual hit rate, that is overconfidence; when it is lower, underconfidence. Put the stated probability on the horizontal axis and the actual hit rate of each probability bin on the vertical axis, and you can see at a glance where the two split. A plot drawn this way is called a reliability diagram.
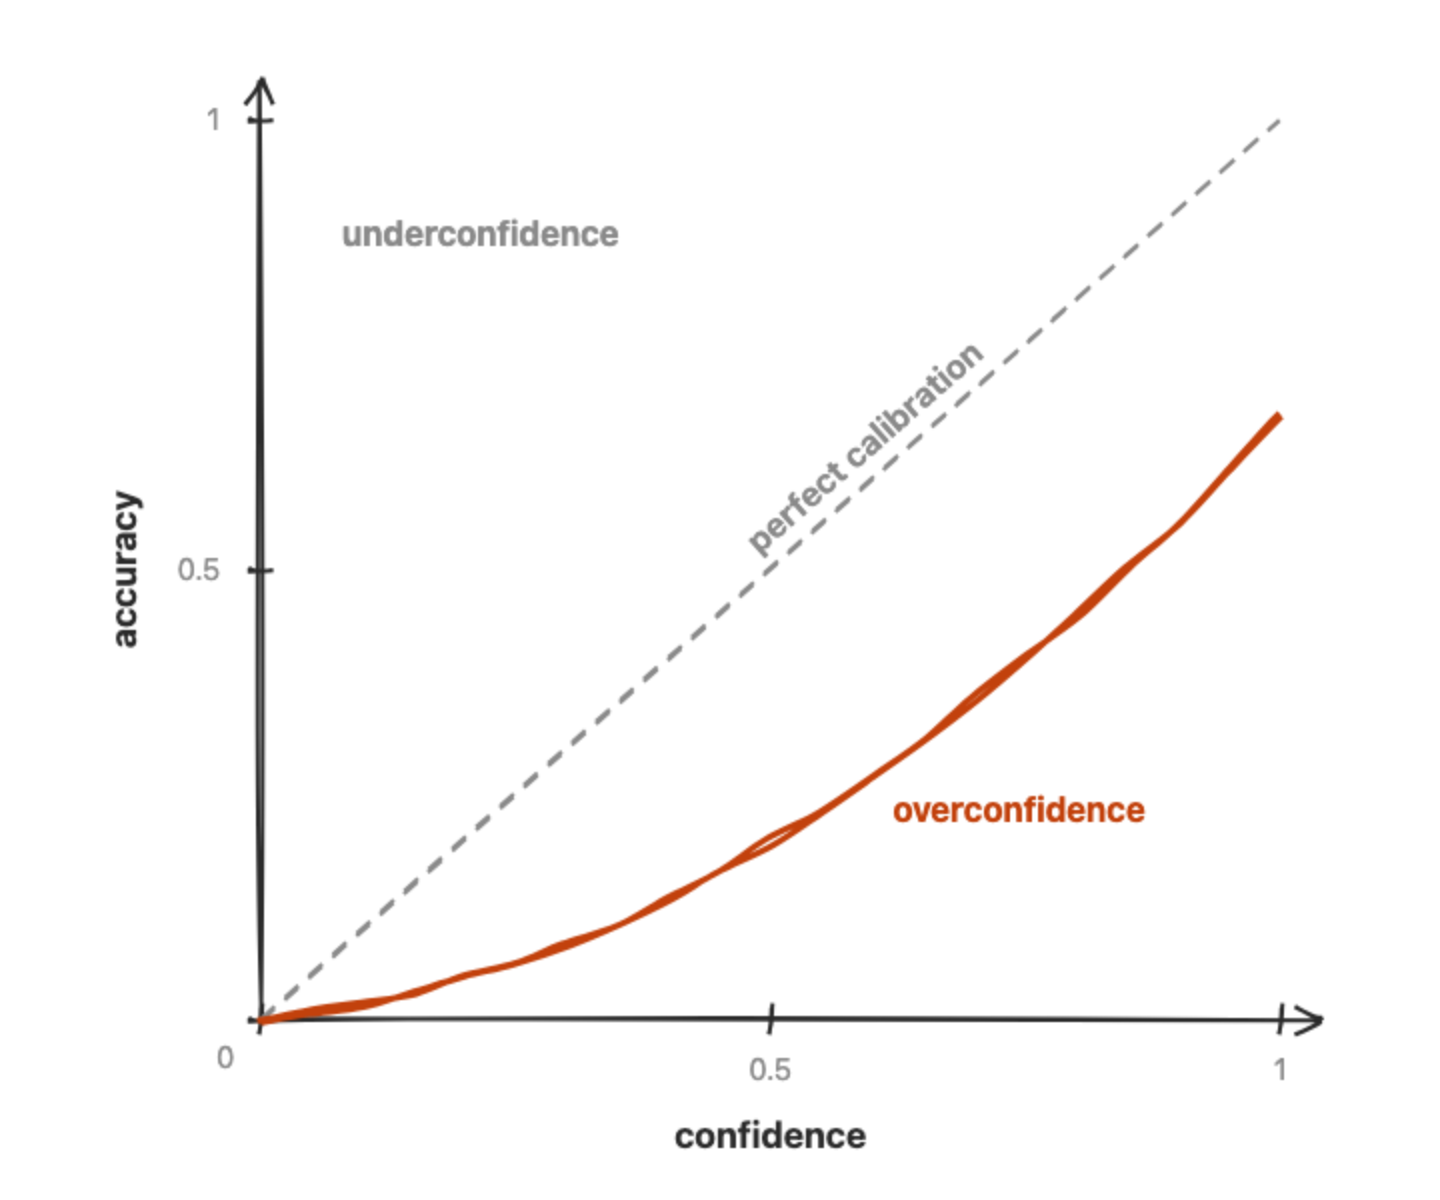
A curve on the diagonal means the model got right as often as it said. The further it sags below the diagonal, the less it gets right relative to the probability it states.
The metric for that gap is ECE (expected calibration error). Following the definition in Guo et al. 2017, for each probability bin it takes the difference between the "stated probability" and the "actual hit rate," weights it by that bin's share of the samples, and averages; 0 is perfect. The code below transcribes that formula. It compares a model that gets 6 of 10 questions right when it says 0.6 every time and when it says 0.95 every time.
// Guo et al. 2017 의 식 (3). 구간은 등간격 10개(논문 실험은 15개), 경계는 왼쪽 닫힘
function ece(preds, M = 10) {
  const bins = Array.from({ length: M }, () => ({ n: 0, hit: 0, conf: 0 }))
  for (const { p, correct } of preds) {
    const b = bins[Math.min(M - 1, Math.floor(p * M))]
    b.n++
    b.hit += correct ? 1 : 0
    b.conf += p
  }
  return bins.reduce(
    (sum, b) => (b.n ? sum + (b.n / preds.length) * Math.abs(b.hit / b.n - b.conf / b.n) : sum),
    0,
  )
}

// 10문제 중 6문제를 맞힌다
const answers = Array.from({ length: 10 }, (_, i) => ({ correct: i < 6 }))
console.log(ece(answers.map((a) => ({ ...a, p: 0.6 }))).toFixed(3)) // 매번 0.6 이라고 말할 때
console.log(ece(answers.map((a) => ({ ...a, p: 0.95 }))).toFixed(3)) // 매번 0.95 라고 말할 때
This is the result of running it with Node v24.16.0 on 2026-10-08.
0.000
0.350
Accuracy is 0.6 in both cases. Only the stated probability changed, yet ECE rises from 0 to 0.35. But because the formula takes an absolute value, ECE measures only the size of the gap, not its direction. A model that says 0.25 every time and still gets 6 questions right also gets an ECE of exactly 0.35. Whether it is overconfidence or underconfidence, you have to look at the reliability diagram or at average confidence minus accuracy.
The RLHF objective
Then why does a model polished with human feedback drift off this scale? First we need to see what RLHF (reinforcement learning from human feedback) optimizes. The skeleton of building a reward model out of human preference comparisons came from Christiano et al. 2017, an early carry-over to language models was Ziegler et al. 2019, and InstructGPT applied it to instruction following. The value pushed up is the score of a reward model that imitates human preference. The language-model work adds to the reward a KL penalty that keeps the model from straying too far from where it stood before reinforcement learning began, and InstructGPT also mixed in gradients from the pretraining data (PPO-ptx), but what it pushes up is still that score.
For a chatbot, human preference is the right objective. The trouble is that this preference leans away from wording that reveals uncertainty. Zhou et al. 2024 showed, on four public preference datasets, that annotators chose answers containing weakeners such as "I'm not sure, maybe" less often. The difference was small but significant. They did not, however, choose answers with strengthened, emphatic certainty more often. Leng et al. 2025 showed that reward models give higher scores to answers that state a high confidence score regardless of their actual quality. Both results concern expressions of confidence in text (verbalized confidence), not token probabilities. TypeSafe, which offers a training method meant to replace RLHF, also notes in its own primer that RLHF can reward confident-sounding hallucinations. That is the position of a vendor selling the alternative.
GPT-4's calibration curves
A drift in the same direction has been observed in token probabilities too. Figure 8 in the main body of the GPT-4 technical report places the reliability diagrams of the pre-trained model and the post-trained model side by side, and the caption reads:
Right: Calibration plot of the post-trained GPT-4 model on the same subset of MMLU. The post-training hurts calibration significantly.
The horizontal axis is the probability (logprob) the model assigned to each of the choices A, B, C, and D on MMLU multiple-choice questions, and the vertical axis is the actual hit rate in that bin. By the numbers printed on Figure 8, the pre-trained model's ECE is 0.007 and that of the model tuned with PPO (the reinforcement learning algorithm used in RLHF to update the model toward higher reward-model scores) is 0.074. More than ten times worse.
In the right-hand (PPO) panel of Figure 8, bars at 0.4 and above sit below the diagonal, but the bins between 0.1 and 0.3 actually sit above it. The bars between 0.1 and 0.9 are bunched flat at an actual hit rate of roughly 0.3 to 0.5, so as the probability the model states goes up, the hit rate barely follows. Those underconfident bins are mixed into the 0.074 as well. And as Guo et al. point out, a reliability diagram does not show how many samples fall in each bin, so the distance of a bar from the diagonal cannot be assumed proportional to the share that bin contributes to ECE.
This panel differs from the concept diagram above in two ways. First, it does not just sag below the diagonal like the curve in the concept diagram; it crosses the diagonal once. Second, it puts the probabilities of all four choices into the bins, so it also differs from the definition in the code above, which measures the probability of the single chosen answer. So I do not compare 0.074 with the 0.35 from the code above on the same scale.
So why did it get worse? The report's main text says only that the pre-trained model was well calibrated and that calibration was reduced after post-training; it does not state a cause. A clue lies in Anthropic's Kadavath et al. 2022. The RLHF policies they trained from their own language models looked very poorly calibrated at face value. The paper called this unsurprising, since RL fine-tuning tends to collapse predictions toward the behaviors that receive the most reward. It was a quick side experiment, not the paper's main subject. Yet applying a single temperature, T=2.5, to every evaluation largely fixed the calibration problems on three evaluations. Temperature is a value that divides the logits; when it is greater than 1, it leaves the order of answers intact and only flattens the probability distribution. I read the fact that one value largely fixed it as meaning the drift was not concentrated in a few bins but was the whole distribution narrowed to one side. The paper also added the caveat that more intensive RL training might distort calibration in ways that cannot be fixed like this.
This is a result on Anthropic's models, so it cannot be carried over directly as the cause of Figure 8. The studies in the previous section also dealt with expressions of confidence in text. I could not find a primary source that directly links the finding that people avoid uncertain wording to the drift in token probabilities.
The probability your code receives
The probability in Figure 8 is a token log probability. To receive the same kind of value, following the OpenAI API specification, you set logprobs to true in a Chat Completions request and use top_logprobs to choose, between 0 and 20, how many candidates to receive at each token position. A value you get by having the model state a confidence number along with its answer is confidence stated in words, and it is a different value from the token probability.
Studies of the two values compare different pairs. Tian et al. 2023 reported that inside RLHF models such as ChatGPT, GPT-4, and Claude, confidence stated in words was typically better calibrated than conditional probabilities, often reducing ECE by a relative 50% or so across three benchmarks. In this comparison, though, the conditional probability of models whose weights are not public was not the API's token probability but an estimate: the share of 10 samples of the same question that produced the answer. Leng et al., seen above, reported that compared with pre-RLHF models, RLHF models are more overconfident in the confidence they state in words. The two results can both hold. And 0.074 is the value the 2023 GPT-4 post-trained model produced on a subset of MMLU, so it cannot be carried over as is to the models you call through the API today.
Wrapping up
To sum up, calibration is not about what percentage you get right but whether you know what percentage you will get right, and ECE is the number that measures the size of the gap. For the direction, you have to look at the reliability diagram or at average confidence minus accuracy. RLHF pushes up the score of a reward model that imitates human preference. Kadavath et al. see that optimization as tending to narrow predictions toward what earns the most reward. There is research showing that people choose answers that reveal uncertainty less often, and that reward models give higher scores to answers stating a high confidence score regardless of quality. In GPT-4, ECE went from 0.007 to 0.074 after post-training, but OpenAI did not go as far as stating the cause. Calibration also comes out differently depending on whether the probability your code receives is a token probability or confidence stated in words, so whichever it is, you need to measure it again on your own data.
Whether the probabilities of Jev, a decision model that puts calibration forward as its training objective, are actually honest is covered in Decision Models, Jev and Kev.
Before you hard-code a model's probability as a threshold, I hope you will check at least once what that model was trained to aim for, and measure whether its scale holds on your own data.