System Observability
In this post, I want to talk about system observability.
I have worked with Sentry-based error monitoring at my company for a long time. When an issue comes in, opening the stack trace, narrowing the scope with releases and tags, and finding reproduction conditions is familiar work. Yet this blog itself had no error monitoring, and only this past August did I attach Sentry in a server-only configuration. And as soon as I did, that instrumentation caught a real incident. The latter half of this post is a record of investigating that incident, believing it was fixed, measuring again, and confirming that the belief was wrong.
In Browser Observability, I looked at what data the browser leaves behind about the network, rendering, and user input. But finding one slow request in the browser does not end the problem. You have to follow whether that request was slow at the CDN, waited at the API server, got stuck in a database call, or caught a failure and returned a default value.
This post starts from a single error event and follows how each signal fills in questions the previous signal could not answer. Breadcrumbs restore the moments right before, traces and metrics find the path and the scope of impact, and profiles and Replay show execution cost and on-screen context. At the end, the question widens to what to instrument as failure, including events that never happened and failures hiding inside successful responses. The incident I went through sat exactly across those two categories.
For frontend engineers this boundary keeps blurring. A request that starts in a React component continues into Server Components, route handlers, external APIs, queues, and background jobs. The symptom shown on screen lives in the browser, but the cause can live in another layer of the system.
It used to be that entering this territory meant first learning each server's log format and operational tools. Now a product like Sentry lets you move between an error and its related trace, profile, and replay, and OpenTelemetry provides a common protocol for different tools to exchange signals.
That does not mean observability completes itself. Which signals to leave, which identifiers to connect them with, and what to call a failure are decisions the people who built the system have to make.
The context around one error
The most familiar starting point is the error event. When an exception occurs, sending the message and stack trace tells you which code failed. But what debugging actually needs is less the exception object itself than the context around it.
Sentry's Issue Details documentation shows that a single event can carry not just a stack trace but breadcrumbs, tags, context, release, trace, replay, and attachments. Each element answers a different question.
| Information | Question it answers |
|---|---|
| stack trace | In which code path did the exception occur |
| source map | Can the deployed bundle location be restored to the original source file and line |
| breadcrumb | What requests and user actions happened before the exception |
| tag | In which browser, release, route, or feature does it repeat |
| context | What structured values are needed to understand this event |
| release·commit | In which deployment did it first appear, and which change is it close to |
| trace | What happened in other services and spans of the same request flow |
| replay | What states did the user actually pass through on screen |
What matters in this distinction is searchability. Sentry's tags are key-value pairs designed for search and filtering in the UI, while context is an area for reading structured values in the event detail and is not a UI filter target. Put everything into context and each individual event becomes rich, but recurring questions like "which customer type is this growing in" become hard to answer.
Send every value as a tag, conversely, and cardinality and storage cost grow. Attributes whose set of values expands without bound, like emails, full URLs, or arbitrary error messages, make poor tags. Instrumentation design is the work of attaching information, and at the same time the work of deciding which questions you will search for repeatedly. In the investigation I describe later, the decisive role was played not by a stack trace but by a single tag I had attached almost in passing.
Server-only instrumentation
This blog's Sentry is server-only. I did not add a browser SDK initialization file. I chose not to pay the client bundle cost that browser instrumentation adds; the goal of adopting it was to catch calls failing quietly on the server, and that part was practically free. So what gets caught and what does not splits cleanly. Errors in route handlers and server components, and failures of the Google Analytics queries that run on the server, are caught. Errors that happen only in the browser, like event handlers in client components or hydration mismatches, are not.
There were two things I wanted to verify for myself in this configuration.
One is the scope of the automatic hook. If you wire up Next.js's onRequestError hook, unhandled route errors are captured without calling captureException directly. I confirmed this by putting up a temporary route on a Deploy Preview that threw an exception on purpose, and the events came in stamped with the mechanism auto.function.nextjs.on_request_error.
The other is source maps. Before applying them, the culprit of a production event was an obfuscated bundle location like y([root-of-the-server]__468aa3ae._). After uploading source maps, the same kind of event resolved to a src/... path, a line number, and even the surrounding source code. This is where the question answered by the table's second row actually splits.
Let me record a side note here. After uploading, I had to delete the .map files from the build output. The server source maps Turbopack produces are 57MB, larger than the server JS (15MB), and if left in place they all get shipped in the deployed function bundle. Conveniently there was a deleteSourcemapsAfterUpload option that deletes source maps after upload, so I turned it on, but when I measured, the server .map files were still sitting there, all 57MB of them, even right after the upload. That option only deletes .next/static and never touches .next/server, which is where the actual bulk lives. I ended up switching to specifying the deletion paths directly, and for the same reason I stopped silencing the upload logs unconditionally and made them conditional. With the logs off, if the upload fails wholesale because a token expired, nobody knows until the next unreadable stack trace. Reading the documentation and turning on an option is a different job from confirming that the option did what you expected.
The difference between groups and causes
Sentry groups similar events into a single issue. In default grouping the stack trace is the core signal, and information like the exception and message is also used. If needed, you can change the grouping criteria with fingerprints.
But the same issue does not necessarily mean the same cause. If a single shared function wrapping fetch() throws network errors, then DNS failures, expired credentials, and 500 responses from upstream can all mix into one group. Conversely, when the same cause produces different exceptions along multiple code paths, it splits into multiple issues.
An issue is a bundle of incidents to investigate, not a classification table of domain causes. Using grouping as-is for incident counts or product KPIs misses this difference.
If needed, you can adjust fingerprints or add a domain error code as a tag. But making grouping rules too fine too early means missing the SDK's default improvements while operational rules pile up. I believe the better order is to first look at the actual event distribution and see which questions the default grouping blocks.
The timeline of a failure
An error usually leaves only the final scene. A breadcrumb attaches what happened before it, in chronological order. Beyond the browser's navigation, clicks, console messages, and HTTP requests, the application can also record its own state changes.
It resembles traditional logging, but the purpose differs slightly. A log store is strong at searching events across a whole service; breadcrumbs are strong at restoring the small timeline right before a specific error.
So an important state change may be needed in both places. If a payment state changed from pending to failed, operational logs aggregate the overall failure rate, while the breadcrumbs on an error event show the sequence for that one user. This is not copying the same fact; it is creating different units of search.
OpenTelemetry's Logs documentation describes automatically connecting existing logs by attaching the identifiers of the active trace and span. The real value of logs lies not in the number of lines but in the junctions that let you move to other signals.
The path where the delay happened
If errors answer "what broke," a trace answers "where did one request pass through and spend its time."
A trace is a bundle of spans. The browser's document load, fetch, the server's route handler, external API calls, database queries, and background jobs can each become a span. If they share the same trace_id, they can be reassembled into a single request graph.
This connection does not appear automatically. Trace context must be passed along when crossing request boundaries. The W3C Trace Context standard defines the format of the traceparent and tracestate headers. It is the minimal common language that lets the same request be stitched together even across different vendors.
On the frontend, there are conditions here too.
- Sending trace headers to every external domain can create information exposure and CORS problems.
- The browser SDK must be scoped to pass context only to allowed API origins.
- The server and upstream must preserve or transform the same headers.
- If each service makes its own sampling decisions, the middle of the trace goes empty.
When a trace is broken, rather than concluding there is no data, you should check at which boundary the context disappeared. Distributed tracing from browser to server depends less on SDK installation than on context propagation design.
Boundaries worth a span
Automatic instrumentation captures library boundaries well: HTTP requests, DB calls, framework lifecycle. OpenTelemetry's Instrumentation documentation explains that zero-code instrumentation is useful as a starting point, but seeing the application's internal decisions requires code-based instrumentation.
For example, an automatic span saying the whole order API took 800ms rarely tells you why it was slow. You may need domain spans like this.
await tracer.startActiveSpan('checkout.calculate-discount', async (span) => {
  span.setAttribute('promotion.type', promotionType)

  try {
    return await calculateDiscount(cart)
  } finally {
    span.end()
  }
})
But creating a span for every function turns the trace into a code execution log. The goal of observability is not to store every call but to distinguish between hypotheses about latency and failure.
Good span boundaries are usually one of the following.
- Boundaries where the failing party changes, like network, DB, or queue
- Boundaries where the execution path forks, like cache hit and miss
- Boundaries where the domain outcome forks, like payment approval or permission decisions
- Work whose latency budget must be managed separately
If you cannot look at one span and say who did what and how much, revisit the boundary or the name.
From distributions to cases
Storing every trace gets expensive fast. So the common approach is to watch the overall state of the system with metrics and descend into traces for the specific requests in an anomalous window.
OpenTelemetry's Signals documentation distinguishes trace, metric, log, and baggage as separate telemetry signals. In the separate Profiles documentation, the profile signal is marked Alpha as of September 2026. The data model and the OTLP transport path exist, but it should not be assumed to be at the same level as the stabilized signals.
The strengths of each signal are as follows.
| Signal | Strength | Weakness |
|---|---|---|
| metric | Overall trends, rates, distributions, alerting | Little context on individual requests |
| trace | The path and latency of one request | Storing everything is expensive |
| log | Detailed records of events, free-form search | Format and cardinality degrade easily |
| profile | The code locations that used CPU and memory | Without linking to requests, user impact blurs |
These signals are not in competition. For example, you find the window where p99 degraded in a latency histogram, open a slow request via an exemplar or trace id, and look at that span's logs and profile.
Grafana Tempo, per its official documentation, provides a structure that derives metrics from traces and connects them with Loki logs and Prometheus metrics. The advantage of an open source stack is that you can design how signals are stored and connected without being locked into a particular SaaS's screens. In exchange, you operate the Collector, storage, retention, query performance, and upgrades yourself.
Where the execution cost lives
The trace told you that some span took 2 seconds, but you may not know where the CPU went inside it. A profile fills this blank by recording function-level execution samples and resource usage.
Here too, trace and profile ask different questions.
- trace: which services and operations did the user's request pass through
- profile: which functions used the CPU during that time
In 2025, Sentry announced Continuous Profiling and UI Profiling as distinct from its existing profiling product. Continuous Profiling looks at long-running resource usage on supported server runtimes, and UI Profiling looks at the execution cost of user sessions. It was initially centered on iOS·macOS and Android, but since December 2025 Browser JavaScript and Electron also support UI Profiling.
Still, not every runtime is measured the same way. In the browser, DevTools CPU profiles and Long Animation Frames can be more direct tools for digging into a specific session. Rather than product names, check the supported platforms, the sampling method, the collection overhead, and the extent of linkage with traces.
Reconstructing the session
When a user says "the button didn't work," errors and traces alone rarely reveal the screen state. Session Replay connects DOM changes, input, navigation, console, and network information into a replayable form.
Sentry's Session Replay FAQ explains that a replay is not a pixel-recorded video but the result of recording the browser DOM and reconstructing it later. So it may not be exactly identical to the original screen, and canvas and external resources come with separate conditions.
This difference also matters from a privacy standpoint. The DOM contains input values, account information, and post content. Sentry's Web Replay SDK provides defaults that mask text and block media, but that does not automatically make your application's DOM structure and custom components safe. Collecting request and response bodies must also be explicitly allowed only for the URLs that need it.
Before turning on Replay, decide the following first.
- Which errors and sessions to keep as samples
- Which DOM areas and inputs to mask or block
- Whether network bodies and headers need to be collected
- Who can view replays and how long to retain them
- Whether the SDK and DOM serialization cost is worth making users bear
Replay is as strong in collection scope as it is in context. The decision between debuggability and data minimization should not be left to product defaults alone. (This blog does not use Replay. For a service where loading performance is the premise of search visibility, I judged that the cost visitors pay outweighs the answers collection would give.)
Failure revealed by absence
Errors, traces, and Replay show deep context for events that occurred. But if a scheduled job never even started, there is no event to record at all.
A cron monitor receives job start and completion states as check-ins and can produce a missed state when no signal arrives at the scheduled time. What is being observed here is not an error thrown by code but the absence of an expected event.
For me this is not someone else's story. This blog automatically collects Search Console data every Monday, and if that job quietly fails to run some week, I currently have no way to know. Nothing failed; nothing happened at all, so no error occurs. The very device that gathers observability data sits in a blind spot.
This perspective applies to health checks, queue consumers, and data collection pipelines as well. A metric saying "zero failure events" alone cannot tell you the system is healthy. You must also look at whether there was input to process, when the last success was, and whether throughput is within its usual range.
What makes observation hard is often not the events that occurred but the events that did not. And this sentence returns once more later, in a way I did not expect.
Failure inside a successful response
Conversely, there are failures where the event did occur but stays invisible because it was classified as success. What I ran into the moment I attached instrumentation was exactly this kind.
The initial plan was simple. Put error reporting in the catch of the stats API route handler, and I would know when a Google Analytics query failed. But when I deliberately made it fail in a local production build by injecting an invalid service account key, the error never reached the route's catch. Four catch blocks in the stats query module one layer below were catching it first and returning defaults, and the response went out like this.
HTTP 200 OK
{ "slug": "/260610", "views": 0 }
The visitor sees stats as 0, and the server answers that everything is fine. Looking only at the route's error rate and uptime, nothing happened. The system's success condition and the user's success condition were different. (I covered which layer should own the catch in Error Handling; back then the question was "where should we catch," and this time I met "we caught it and nobody knows.")
So I moved the instrumentation points from the route to those four places, and attached a tag distinguishing which query blew up. This tag plays a decisive role later.
This situation already has a precise name. The Gray Failure paper that Microsoft and the Azure team presented at HotOS 2017 says that the major availability incidents in the cloud mostly come not from the kind that stops completely but from this gray zone, and defines its key feature like this.
We argue that a key feature of gray failure is differential observability: that the system's failure detectors may not notice problems even when applications are afflicted by them.
we argue that a key feature of gray failure is differential observability: that the system's failure detectors may not notice problems even when applications are afflicted by them.
One party is being harmed by the failure while another party does not perceive it, and the problem is that the latter is the one responsible for failure detection. Moving my instrumentation point down from the route to the lower layer was exactly the work of closing that perception gap.
The solution is not to turn every default return into a failure. A fallback can be the right choice to protect the user experience. Instead, the fact that the fallback ran, the latency of the original call, and the affected feature must be left as separate signals.
try {
  return await fetchAnalyticsStats()
} catch (error) {
  captureException(error, { tags: { gaQuery: 'stats' } })

  return { totalPageViews: 0, todayVisitors: 0 }
}
What must be observed is not the exception but the fact that the system left its normal path.
The GA call that hung for 65 seconds
The first real production issue that came in after moving the instrumentation points is the next scene of this story. A GA call was failing with DEADLINE_EXCEEDED after 65.877 seconds. Yet because of the structure above, the response was still 200. At the time, the home page was rendering dynamically and streaming the stats area in, so the page itself appeared right away. Instead, that spot stayed in a loading state for a long time and then quietly filled with zeros.
Digging into the cause, the configuration file of the GA client library I use had this baked in.
"RunReport": { "timeout_millis": 60000, "retry_params_name": "default" }The library's default RPC timeout is 60 seconds, and my code was not passing a timeout at any of its five call sites. This is not a mistake unique to me; it is a widely warned-about kind. The deadlines post on the official gRPC blog, written by Google SRE Gráinne Sheerin, opens with "TL;DR: Always set a deadline" as the first line under the title, and explains that without a deadline, an in-flight request can hold resources and hang up to the maximum timeout. The GA client I use is gRPC-based too, so the documentation had already warned about the same principle; the call sites just were not honoring it.
The fix was to fix the timeout at 5 seconds and pass it to every call site. And I reproduced it deterministically by standing up a local TCP server that never responds.
| Condition | Elapsed time | Error message |
|---|---|---|
| No timeout (before fix) | 60.04 seconds | Deadline exceeded after 60.000s |
timeout: 5000 (after fix) |
5.00 seconds | Deadline exceeded after 5.000s |
The numbers moved as described, so I had at least confirmed that the timeout setting reaches the code. To be clear, there is no evidence behind the number 5 itself. I had not measured GA's response latency distribution when healthy, so it is effectively an arbitrarily chosen value. The direction, though, had something to lean on. Embracing Risk from the Google SRE book says that 100% is never the right reliability target. On this blog, visitor numbers are auxiliary information. Giving up fast and drawing defaults is better for the visitor experience than fetching them accurately.
The distribution measured again after the fix
This was supposed to be the ending of this investigation. The cause was found, reproduced, and fixed. But then I discovered that in the release where the fix commit was deployed, more than a hundred DEADLINE_EXCEEDED events of the same family had piled up.
I pulled the most recent 100 and looked at the distribution of the reported durations. One thing to note upfront: this value is not the time GA actually spent responding. It is the wall-clock time from the moment the deadline timer was set to the moment that timer actually fired.
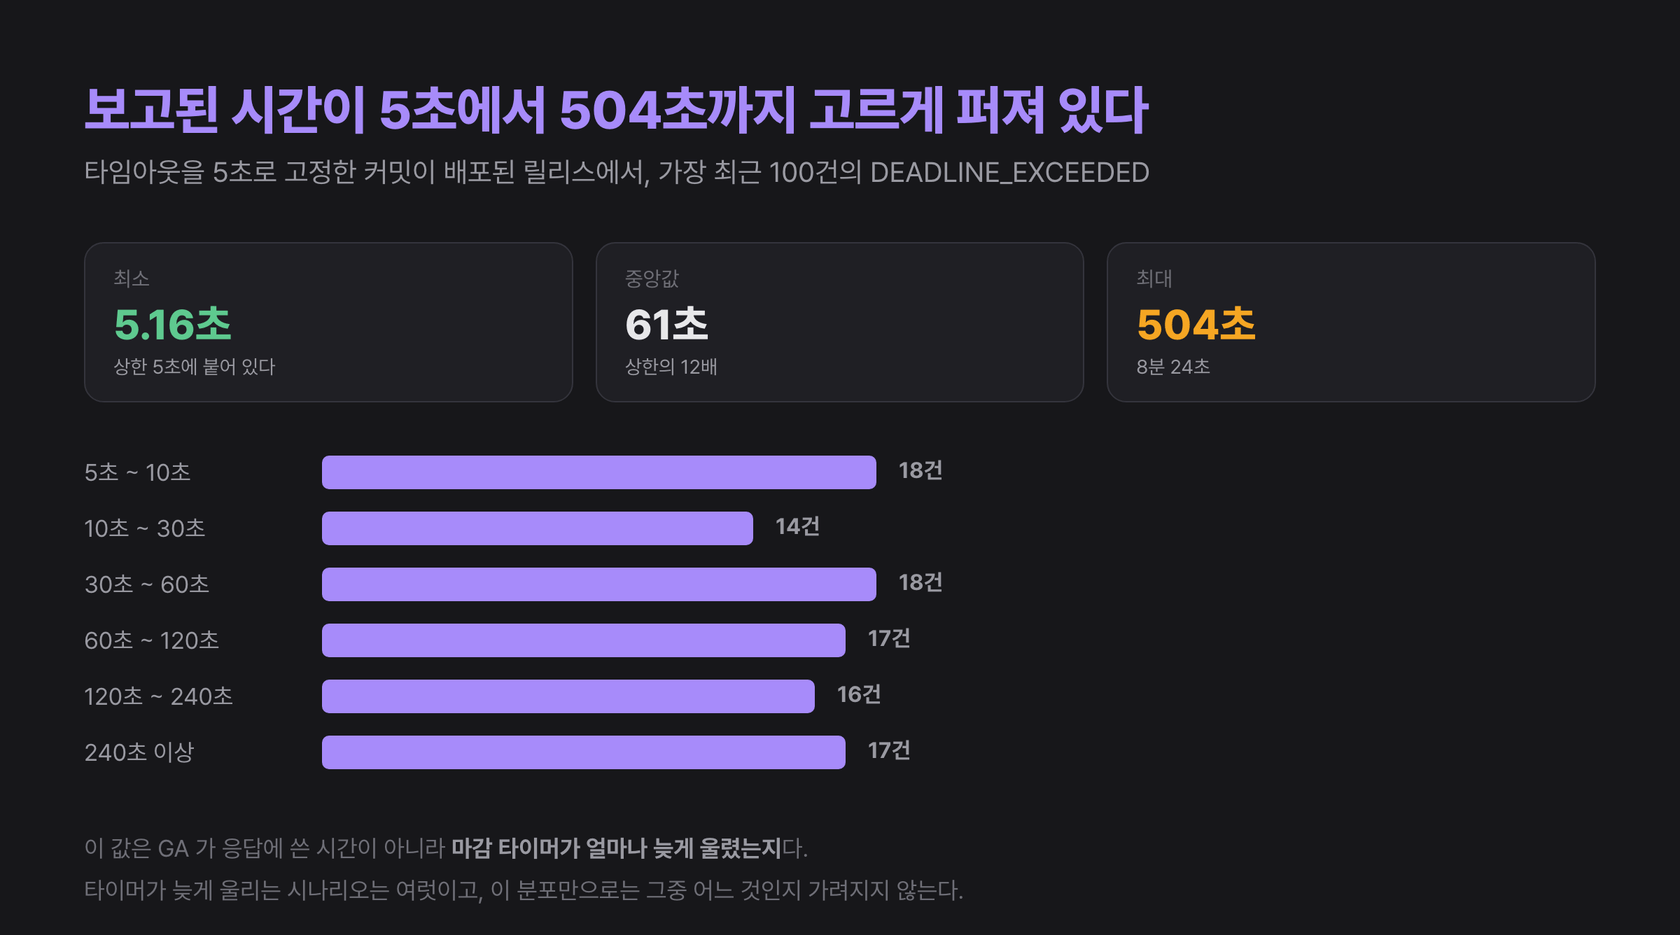
Reading it goes like this. The lower bound held. Not a single event was cut off shorter than 5 seconds, and the shortest is 5.16 seconds, so the 5-second setting itself is reaching the code. But the upper side climbs to 8 minutes 24 seconds, and the median is 61 seconds. Stranger still, the values do not cluster in any band. If these were delays caused by GA actually being slow, they should pile up near the cap, and they do not.
The tags told me more. The only tags stamped on the 100 events are stats and popular, and they mostly arrive as a pair. What these two paths have in common is that both are revalidation paths sitting behind a one-hour cache. Meanwhile, the remaining paths that take a visitor's request and call GA on the spot without a cache (page, pages) never once appear among the 100. It means the failures are happening not while a visitor's request is being served but only in the work that refills the cache after the response is done.
This observation shakes one sentence I wrote in an earlier section. I wrote that the stats spot stayed loading for a long time, but if the failures occur only on the post-response path, visitors may never have waited through that time. There was one more sentence I had written without measuring.
Here is the hypothesis I formed. This blog runs on serverless functions, and a serverless function's execution environment freezes after sending a response until the next invocation. If the timer freezes along with it and fires late when the function wakes up, the recorded value can be inflated in wall-clock time terms rather than reflecting the time actually waited. It fits the lower bound sitting exactly at 5 seconds, fits the upper values clustering nowhere, and fits the observation that failures come only from post-response work.
But this is where care is needed. A distribution that does not contradict a hypothesis is different from a distribution that supports it. There is more than one scenario in which a timer fires late. Besides a serverless freeze, heavy rendering could have been holding the event loop, or the container could have been throttling the CPU. I also kept as a candidate the fact that the library configuration's total retry budget is 600 seconds, and the observed maximum of 504 seconds fits inside it. All of them can produce a distribution of this same shape, so this graph does not narrow the candidates.
What crosses one candidate off is the CPU time over the same interval. If CPU time is nearly zero while 61 seconds of wall-clock time pass, the explanation that heavy rendering was holding the event loop drops out. This is the question answered by the profile signal we saw earlier.
But CPU time does not settle it. While a response is genuinely being awaited, CPU time also stays close to zero, so an interval spent waiting and an interval spent frozen look the same. To tell the two apart, you have to look at whether time flowed evenly inside that interval. One way is to set a timer that fires repeatedly at short intervals and see whether there is a point where the gap suddenly widens. If the execution environment froze, the gaps jump; if it was genuinely waiting, they flow evenly. Measuring the clock only just before and after the call will not do. Wall-clock time keeps flowing even while the function is frozen, so that only recreates the number I already have.
I will add that I did not get this issue list, tag distribution, and duration values by opening a dashboard. I attached the official Sentry MCP server and asked an agent. Not only has the cost of attaching instrumentation come down; the cost of opening up the accumulated data has come down too.
The fix was not why it stopped
While writing this post, I queried that issue again. To check whether what I believed I had fixed is still fixed now.
As of September 14, 2026, that family of issues had stopped at a total of 144 events. The last occurrence was August 18, with 0 events in the 27 days since. The tag distribution remained only the stats and popular pair to the very end. Looking only at the occurrence graph, the problem seems to have disappeared.
But in the meantime I had done none of the measurements described in the previous section. I never validated the hypothesis and fixed anything, so why did it stop? Matching against the deploy history, the answer was elsewhere. The multilingual overhaul committed on the day the last event was recorded removed the visitor stats and popular posts sections from the home page. The screens that call the stats and popular revalidation paths were exactly those two, so after that overhaul was deployed to production, there is simply no occasion for the failing code to be called. The failing code was not fixed; the screen that called it disappeared.
So this incident was not resolved; the subject of observation disappeared. The serverless freeze hypothesis remains unverified, and the reproduction conditions for recreating that distribution in production disappeared with it. The original event of the very first issue that reported 65.877 seconds has passed its retention period and can no longer even be opened.
There is a reason I keep this section. A resolved state in the issue list is not proof of root cause analysis. There are multiple paths to occurrences reaching zero. It was actually fixed, or nobody walks that path anymore, or the instrumentation itself disappeared. Error signals alone cannot distinguish these three. What distinguishes them are the signals of the normal path, like call volume and the time of the last success, and that is one more reason the observation of "events that did not happen" from the earlier section is needed. If attaching instrumentation is a one-time task, observation is the work of measuring again and again.
The knowledge limits of sampling
Traces, replays, and profiles need sampling because of storage cost and client overhead. The problem is that lowering the sample rate does not only reduce cost; it also reduces the questions you can answer.
A random 10% sample may be fine for estimating the overall distribution, but it can miss rare errors. That is why you need policies that additionally keep replays only for sessions with errors, or preferentially retain slow traces and failed traces.
Conversely, keeping only failed requests removes the baseline for comparing against normal users. You cannot judge whether a slow request is exceptionally slow or the whole system is slow.
I paid this cost myself. To save money, this blog was set to keep only 10% of trace samples, and in the investigation above, telling whether the inflated elapsed times were real waiting required the start and end of the call interval in question, and the sample was too shallow to contain a trace for the problematic requests. What I saved was my bill; what I lost was a question I could answer.
Sampling should be a per-question policy, not a single number.
- A probabilistic sample for the baseline
- A priority sample for errors and latency thresholds
- A temporary sample for investigating a particular release or feature
- A separate sample for replay·profile, where privacy and cost are high
Data you did not store cannot be restored afterward, not even by AI.
Instrumentation design after AI
AI is useful in system observability because the data is already structured. Issues, events, tags, spans, traces, and releases can be queried via API, and logs and profiles carry time and identifiers too. That I could get an issue's tag distribution and the date its occurrences stopped by asking an agent from my editor is thanks to this structure.
In June 2026, Sentry expanded its API documentation for agents and automation, including endpoints related to tracing, profiling, and attachments. It shows that observability data is being used not only as information humans read on dashboards but also as an interface where agents query for evidence.
AI makes explorations like these fast.
- Finding issue and tag combinations that grew after a recent release
- Summarizing a specific trace's slow spans and associated logs
- Finding breadcrumbs and browser environments common across multiple events
- Connecting a profile's hot paths to candidate commits
- Proposing reproduction hypotheses and additional instrumentation points
But domain state that was never instrumented is unknowable to agents as well. Where to leave attributes like checkout.result, cache.status, and fallback.reason can only be decided by understanding the code and the users' expectations. In my investigation, the agent could pull the distribution and tags instantly because the judgment to lower the instrumentation points and attach tags had come first.
AI can propose root causes, but what to define as failure, and which users to observe at what cost, is an engineering judgment.
Signals into one incident
Turning on every Sentry feature is not the conclusion of this post. From an error you should be able to look at the past through breadcrumbs, follow the request path through traces, check the scope of impact with metrics, and descend into replay and profile when needed. On top of that, the absence of expected events, as with cron monitors, and deviations classified as normal responses must enter the same investigation flow.
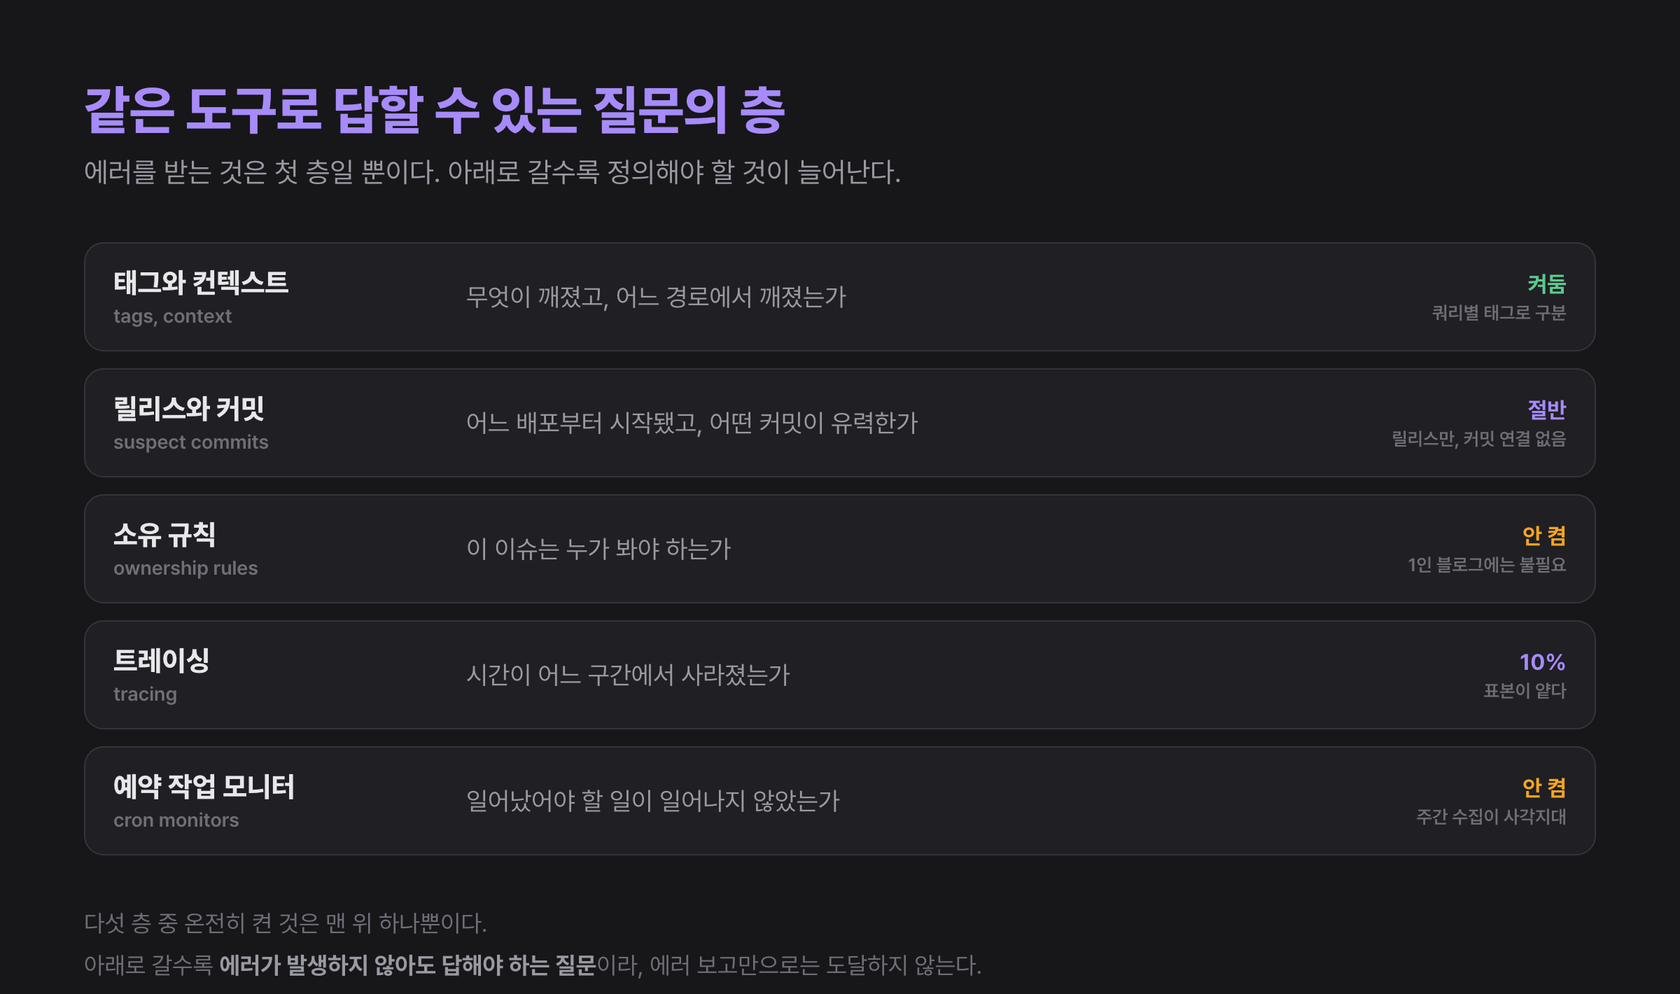
I do not think it is an embarrassing report card that, of the five layers, the only thing this blog has fully turned on is a single tag. Which layers to enable is not decided by scanning a feature list; only after deciding what to regard as failure can you know which layers you need. That said, in this investigation the blanks in two layers, the shallow trace sample and the blind spot in weekly collection, came back as real costs, so the next layers to turn on have effectively been decided.
OpenTelemetry's trace context and semantic conventions extend this navigation path beyond any single product. But JavaScript browser instrumentation is still experimental, and the profile signal is Alpha. Being included in the standard and being stable to use on each runtime must be kept distinct.
AI quickly finds candidates for searching and connecting these signals. But the depth of observability is decided not by a product's feature count but by whether you can move between signals, and whether you expressed the states that left the normal path. My 200 responses never once spoke of failure until I planted the signal, and only after planting it did it turn out that they had been failures.
In the next post, From Observation to Judgment, I want to look at how to interpret this system information together with the user data from GA4 and Search Console. Looking closely at the system alone cannot decide what to fix first. Before that, I hope the readers of this post will call to mind one issue they closed as resolved. Did it stop because it was fixed, or has simply nobody measured it again?